Copyright
©The Author(s) 2024.
World J Gastroenterol. Jul 28, 2024; 30(28): 3428-3446
Published online Jul 28, 2024. doi: 10.3748/wjg.v30.i28.3428
Published online Jul 28, 2024. doi: 10.3748/wjg.v30.i28.3428
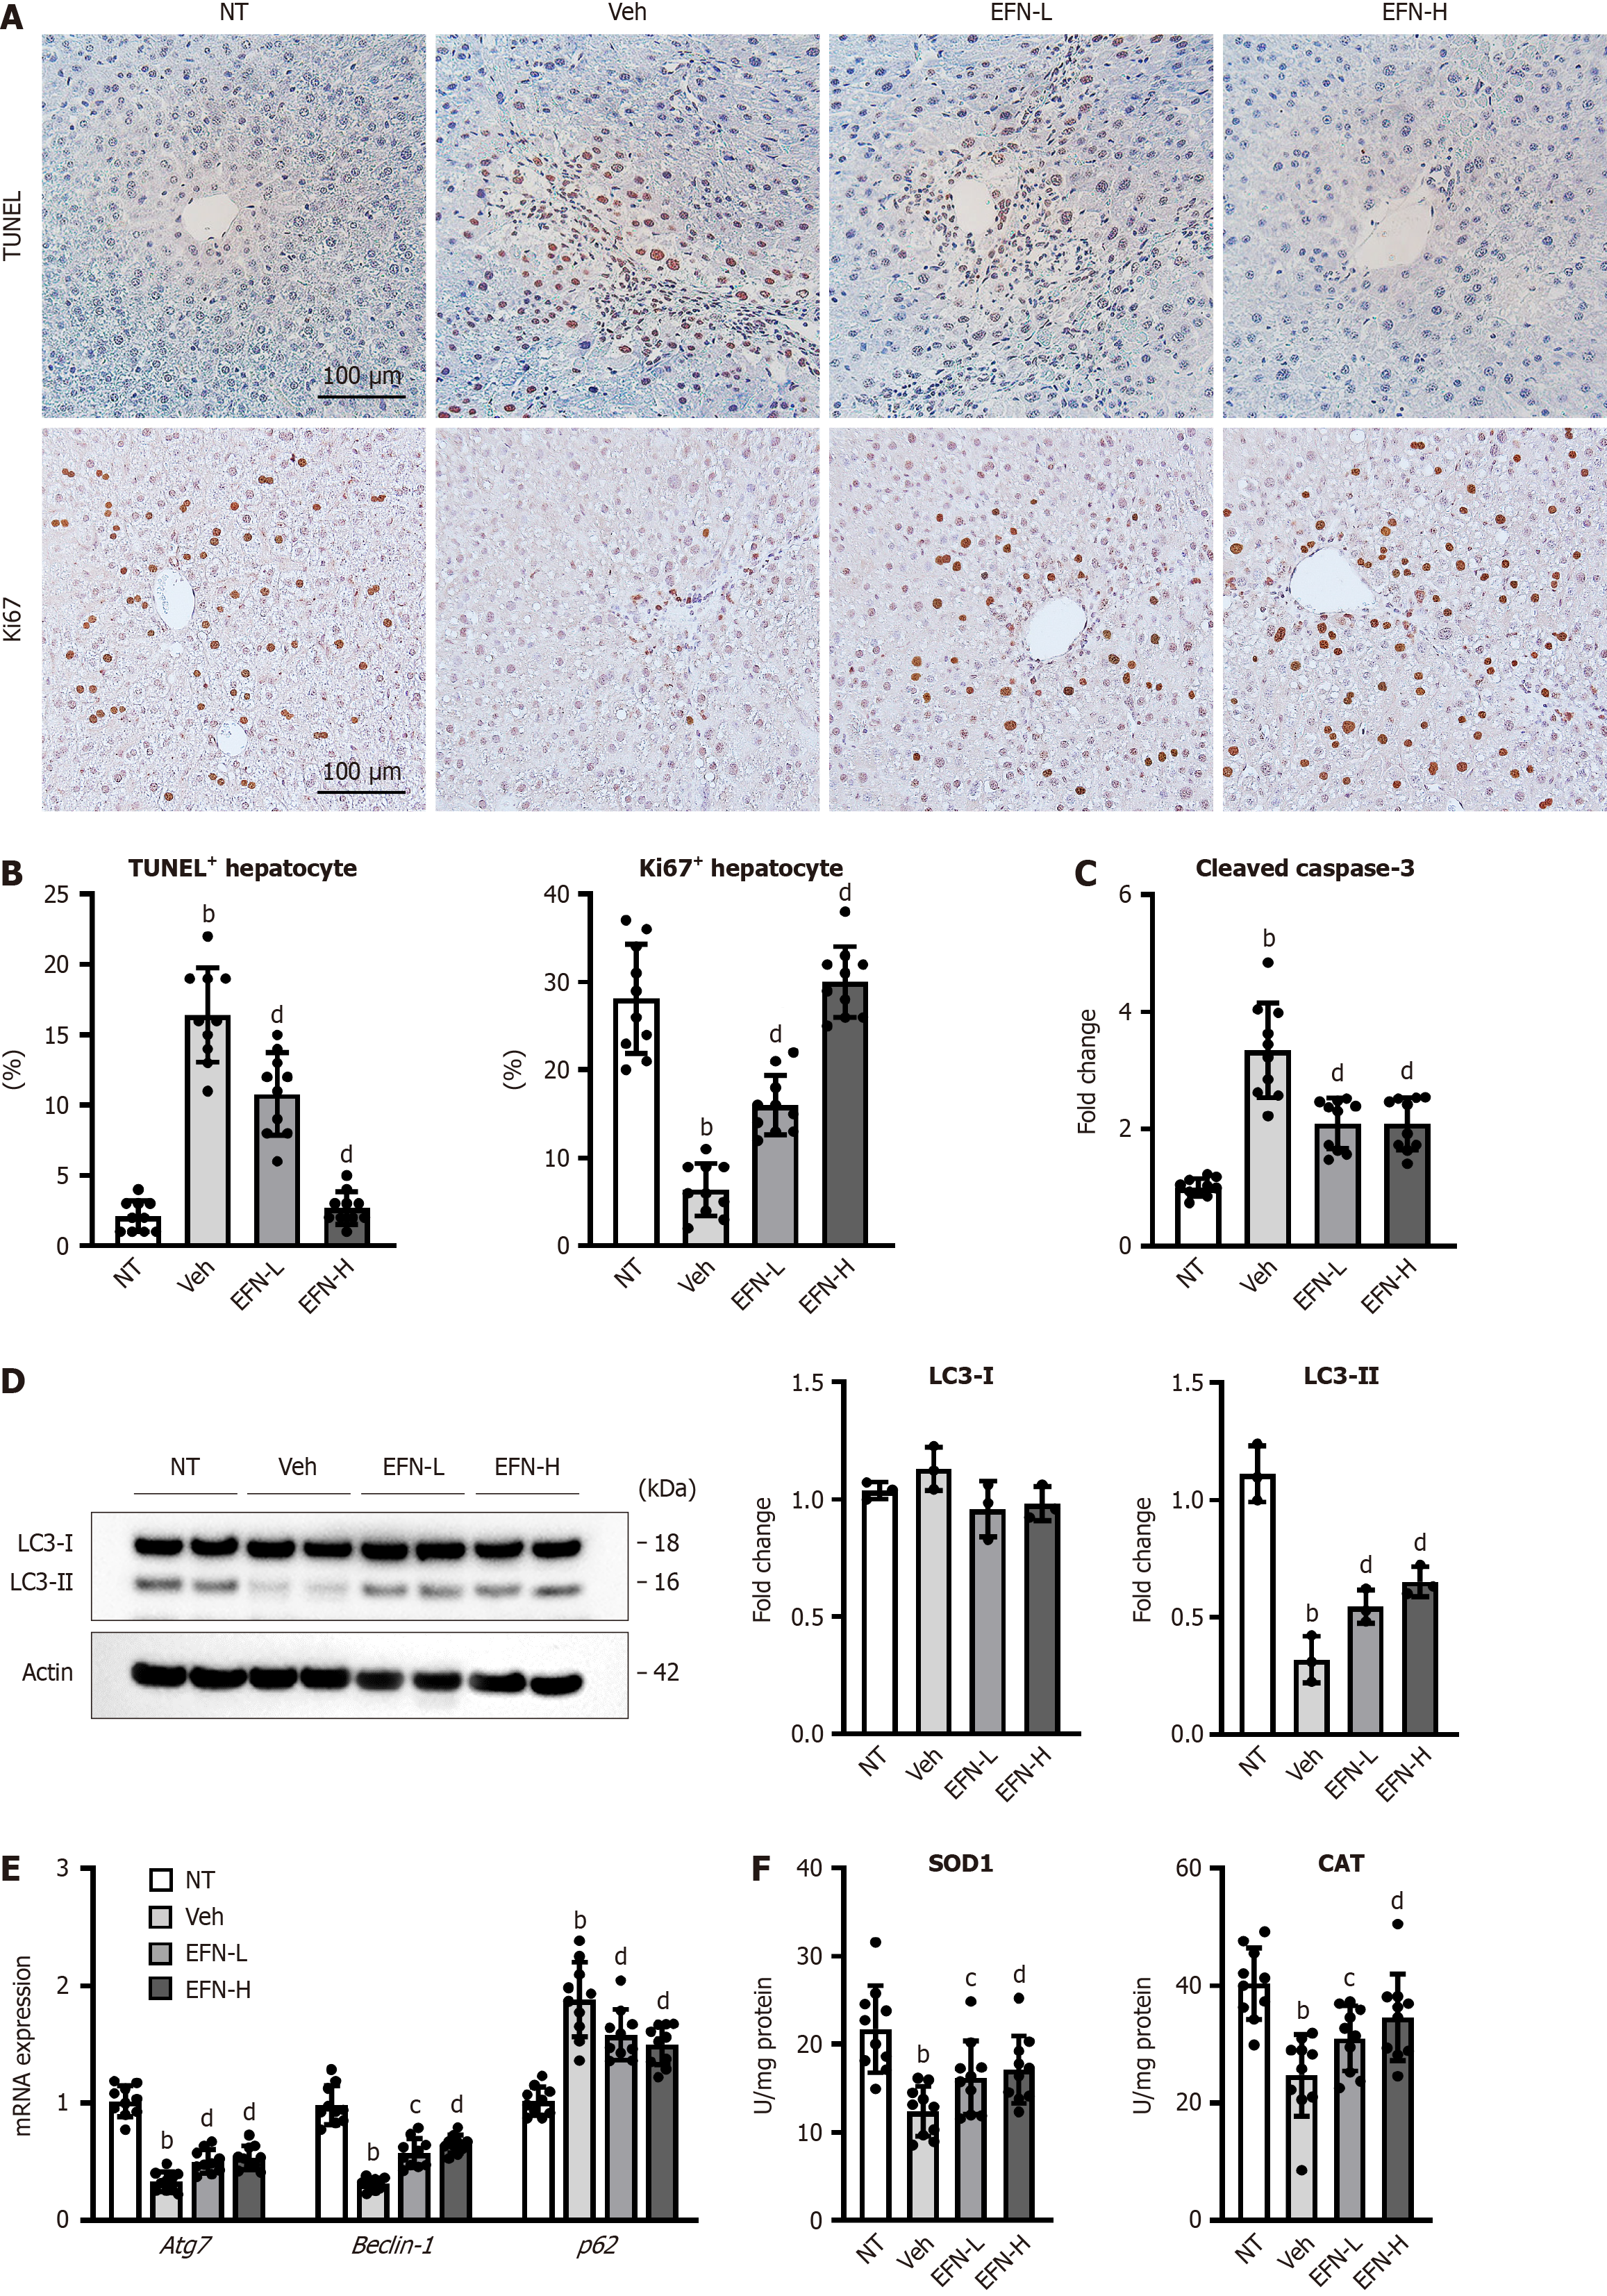
Figure 2 Elafibranor on hepatocyte cell death, autophagy and oxidative stress in the alcohol-associated liver disease mice.
A: Representative microphotographs of TdT-mediated dUTP Nick End Labeling (TUNEL) and Ki67 staining of the livers in the experimental mice; B: Quantification of TUNEL-positive hepatocytes and Ki67-positive hepatocytes in high-power field (n = 10); C: Cleaved caspase-3 level in the liver tissue (n = 10); D: Western blot for LC3-1 and 2 protein level in the liver tissue. Actin was used as an internal control (n = 3); E: Hepatic mRNA level of the markers related to autophagy (n = 10); F: Hepatic level of antioxidant enzymes, superoxide dismutase 1 and catalase (n = 10). Glyceraldehyde-3-phosphate dehydrogenase was used as an internal control for real-time quantitative polymerase chain reaction (E and F). Quantitative values are indicated as fold changes to the values of non-therapeutic group (C-E). Data are the mean ± SD. bP < 0.01 vs non-therapeutic group; cP < 0.05 vs vehicle-treated alcohol-associated liver disease group; dP < 0.01 vs vehicle-treated alcohol-associated liver disease group, significant difference between groups by Student’s t-test. NT: Non-therapeutic group; Veh: Vehicle-treated alcohol-associated liver disease group; EFN-L: Elafiblanor (3 mg/kg/day)-treated alcohol-associated liver disease group; EFN-H: Elafibranor (10 mg/kg/day)-treated alcohol-associated liver disease group; TUNEL: TdT-mediated dUTP Nick End Labeling; SOD: Superoxide dismutase; CAT: Catalase.
- Citation: Koizumi A, Kaji K, Nishimura N, Asada S, Matsuda T, Tanaka M, Yorioka N, Tsuji Y, Kitagawa K, Sato S, Namisaki T, Akahane T, Yoshiji H. Effects of elafibranor on liver fibrosis and gut barrier function in a mouse model of alcohol-associated liver disease. World J Gastroenterol 2024; 30(28): 3428-3446
- URL: https://www.wjgnet.com/1007-9327/full/v30/i28/3428.htm
- DOI: https://dx.doi.org/10.3748/wjg.v30.i28.3428


