Copyright
©The Author(s) 2024.
World J Gastroenterol. Jun 28, 2024; 30(24): 3106-3119
Published online Jun 28, 2024. doi: 10.3748/wjg.v30.i24.3106
Published online Jun 28, 2024. doi: 10.3748/wjg.v30.i24.3106
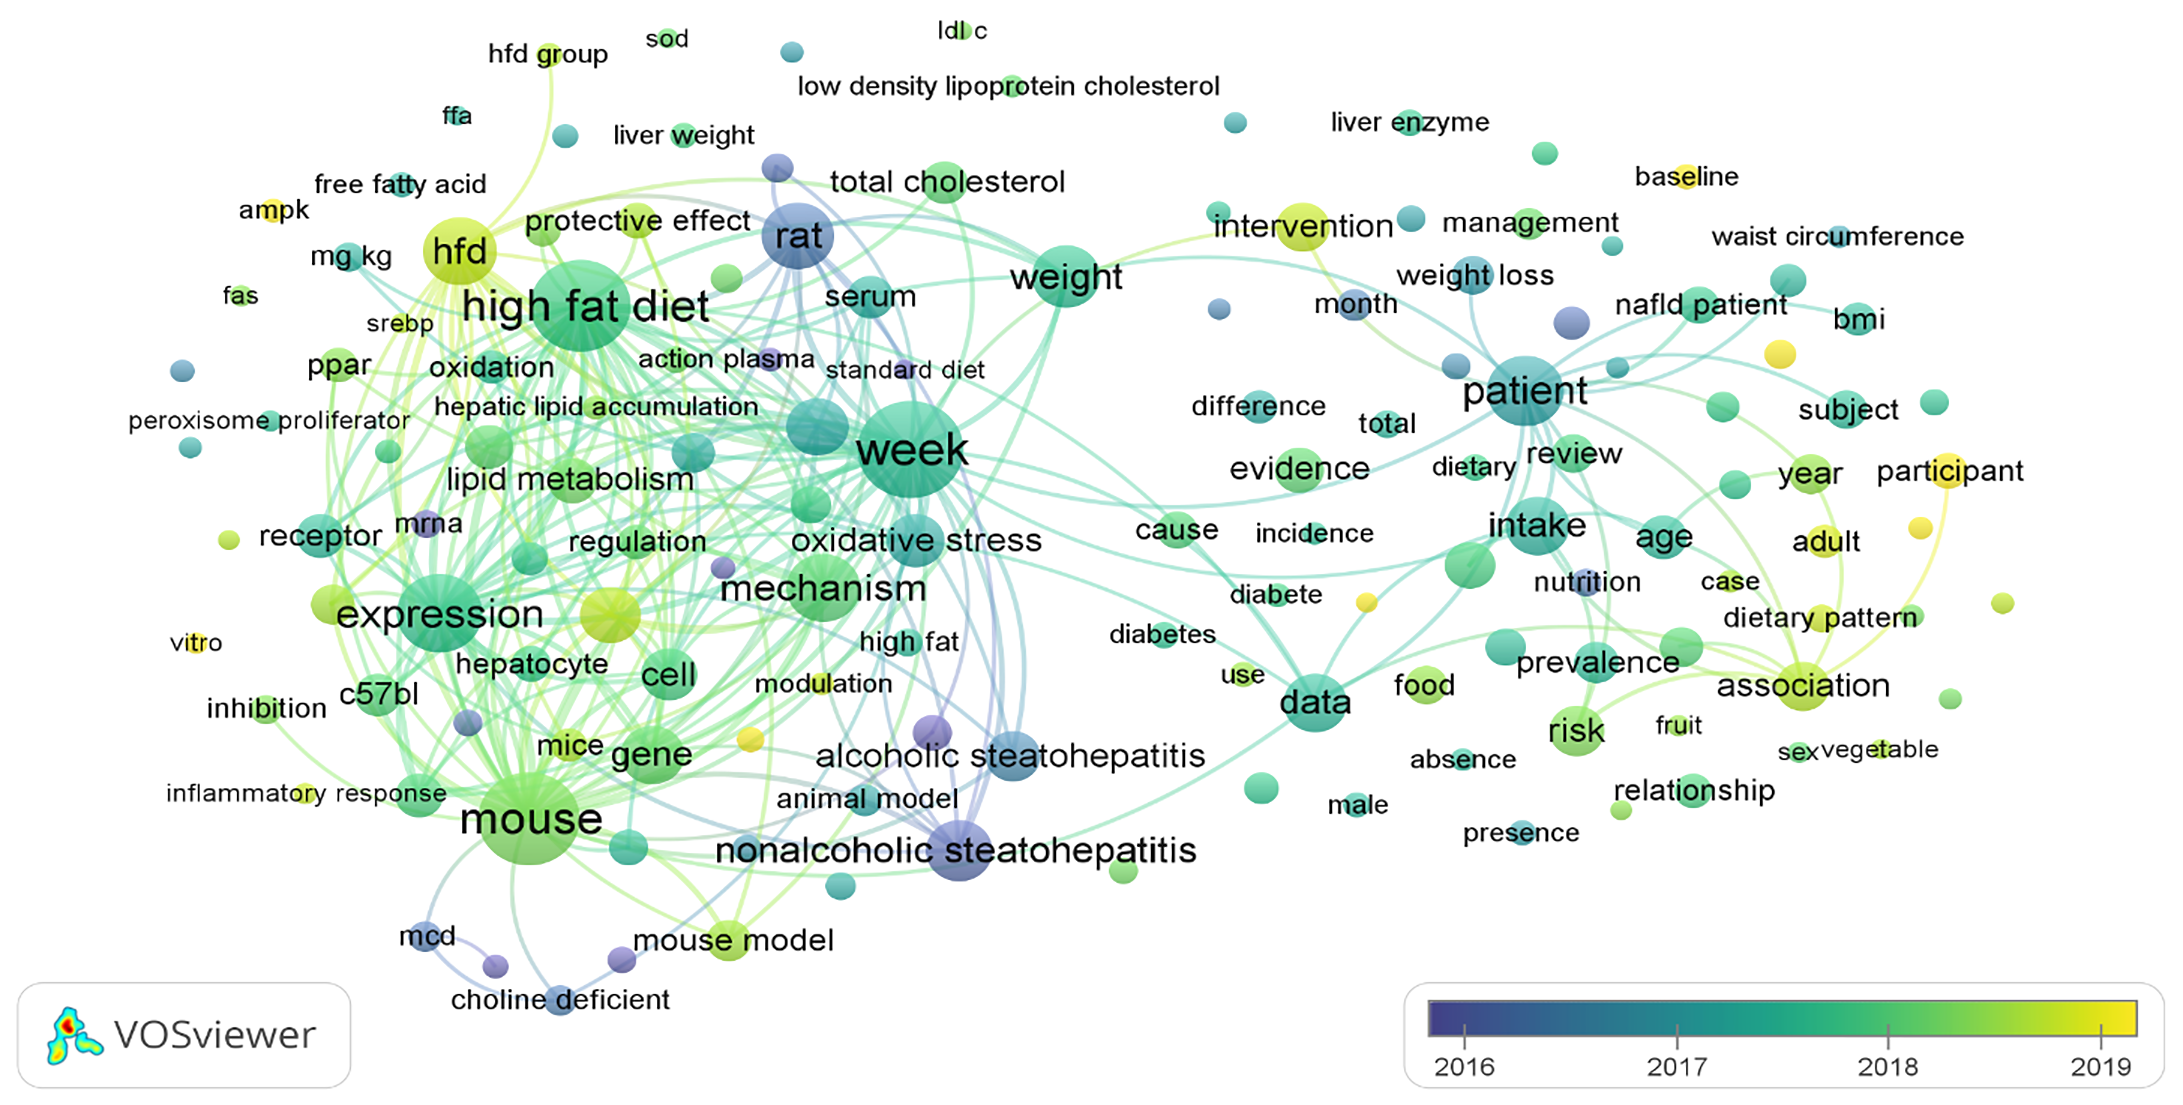
Figure 4 Visualization of term analysis in publications on diet and nonalcoholic fatty liver disease (1987-2022).
This network visualization map presents an in-depth analysis of terms extracted from the titles and abstracts of publications focusing on diet and nonalcoholic fatty liver disease. The map highlights the frequency of term usage, depicting earlier instances in blue and later occurrences in yellow. The map was created by VOSviewer software version 1.6.20.
- Citation: Shakhshir M, Zyoud SH. Mapping global research trends: Nutrition associations with nonalcoholic fatty liver disease - a Scopus bibliometric analysis. World J Gastroenterol 2024; 30(24): 3106-3119
- URL: https://www.wjgnet.com/1007-9327/full/v30/i24/3106.htm
- DOI: https://dx.doi.org/10.3748/wjg.v30.i24.3106


