Copyright
©The Author(s) 2024.
World J Gastroenterol. Jun 28, 2024; 30(24): 3106-3119
Published online Jun 28, 2024. doi: 10.3748/wjg.v30.i24.3106
Published online Jun 28, 2024. doi: 10.3748/wjg.v30.i24.3106
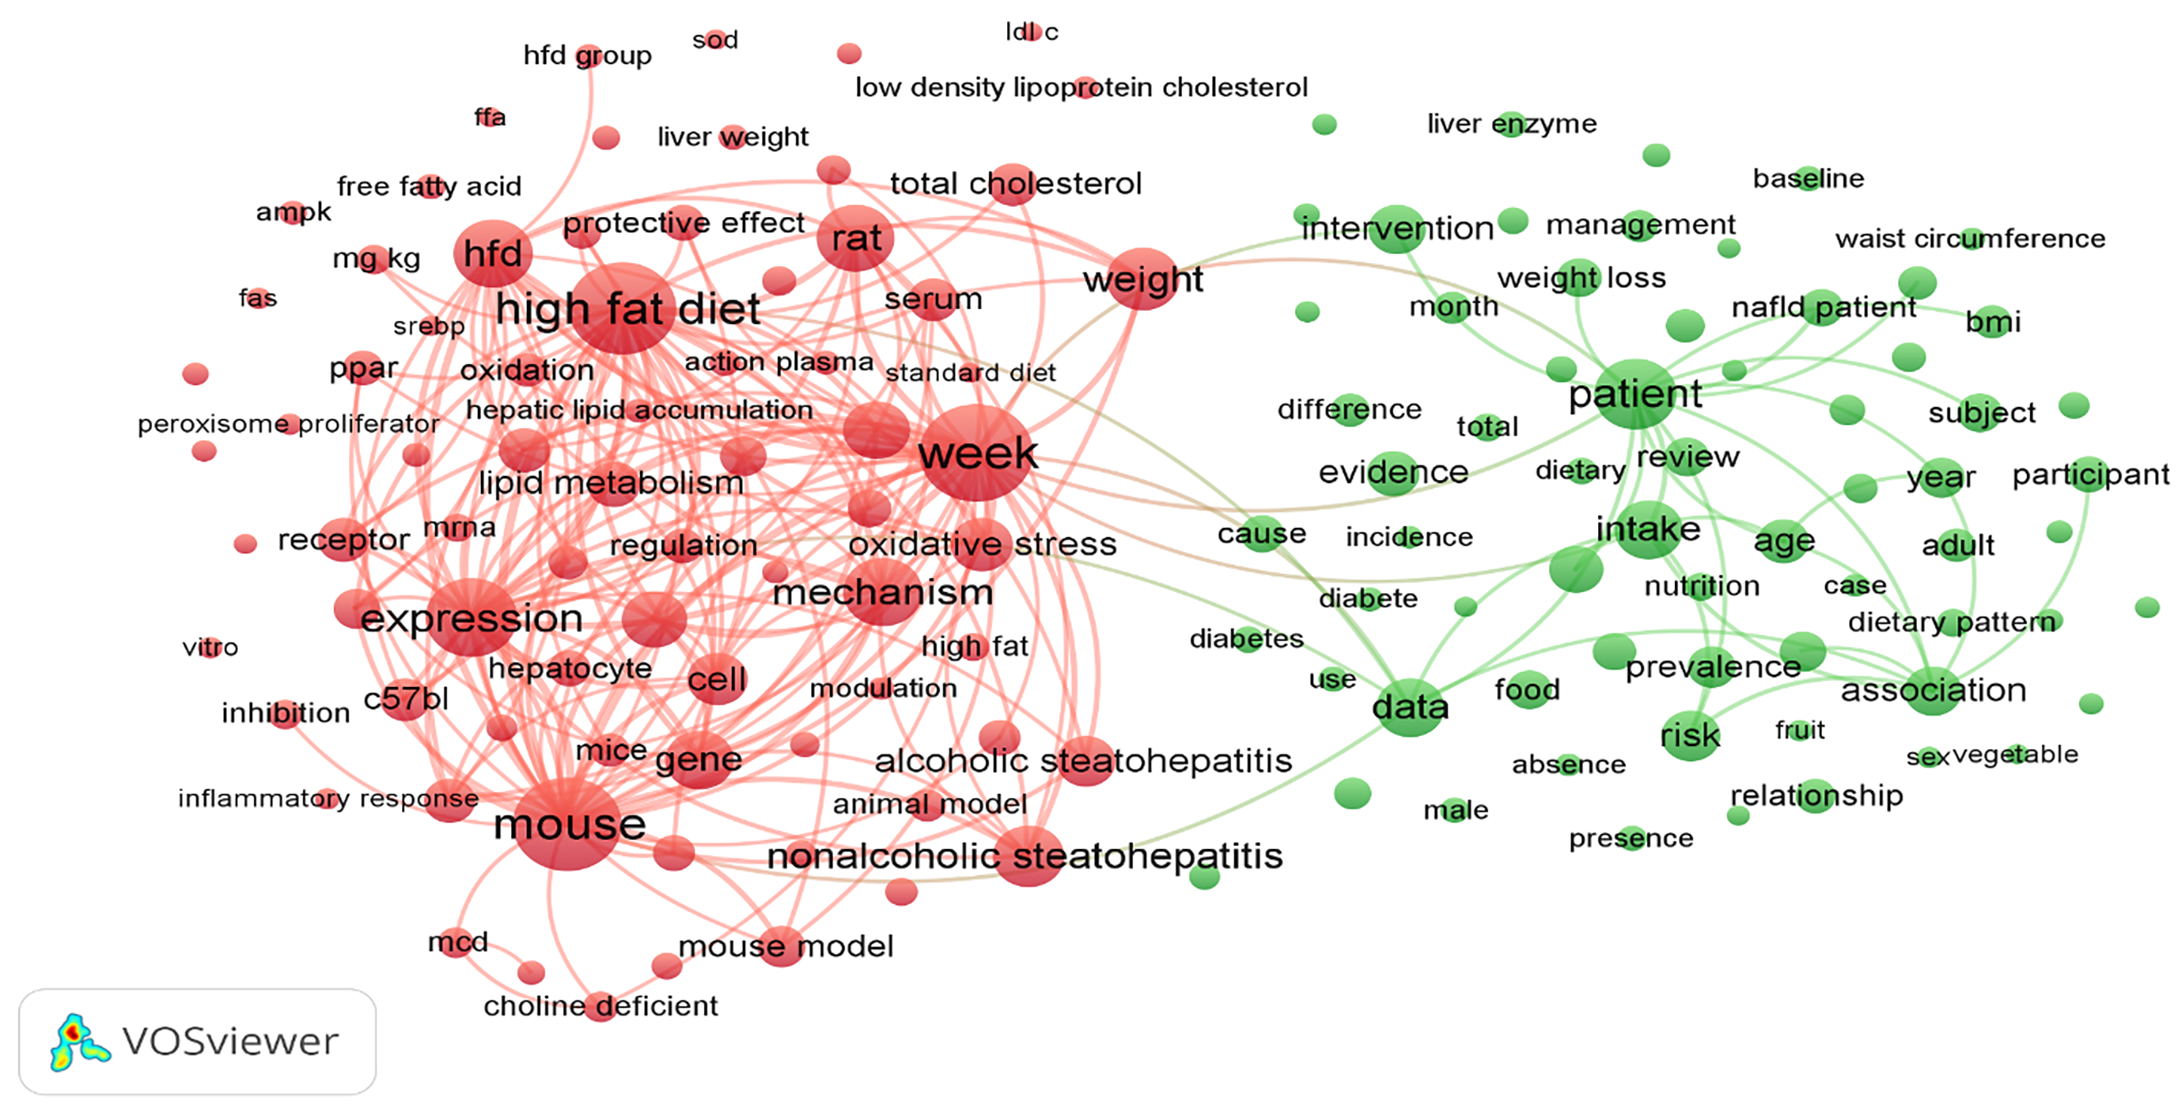
Figure 3 Visualization of terms in publications on diet and nonalcoholic fatty liver disease.
To elucidate the interconnections among terms within the title and abstract sections of publications related to diet and nonalcoholic fatty liver disease spanning the years 1987 to 2022, a network visualization map was constructed using VOSviewer software version 1.6.20. A minimum-term occurrence threshold of 50 was applied, leading to the identification of 236 terms of a total of 31407 in this domain. These terms were then grouped into two distinct clusters, each denoted by a unique color. The size of individual nodes on the map reflects the frequency with which a term was used across various publications.
- Citation: Shakhshir M, Zyoud SH. Mapping global research trends: Nutrition associations with nonalcoholic fatty liver disease - a Scopus bibliometric analysis. World J Gastroenterol 2024; 30(24): 3106-3119
- URL: https://www.wjgnet.com/1007-9327/full/v30/i24/3106.htm
- DOI: https://dx.doi.org/10.3748/wjg.v30.i24.3106


