Copyright
©The Author(s) 2024.
World J Gastroenterol. Jun 28, 2024; 30(24): 3059-3075
Published online Jun 28, 2024. doi: 10.3748/wjg.v30.i24.3059
Published online Jun 28, 2024. doi: 10.3748/wjg.v30.i24.3059
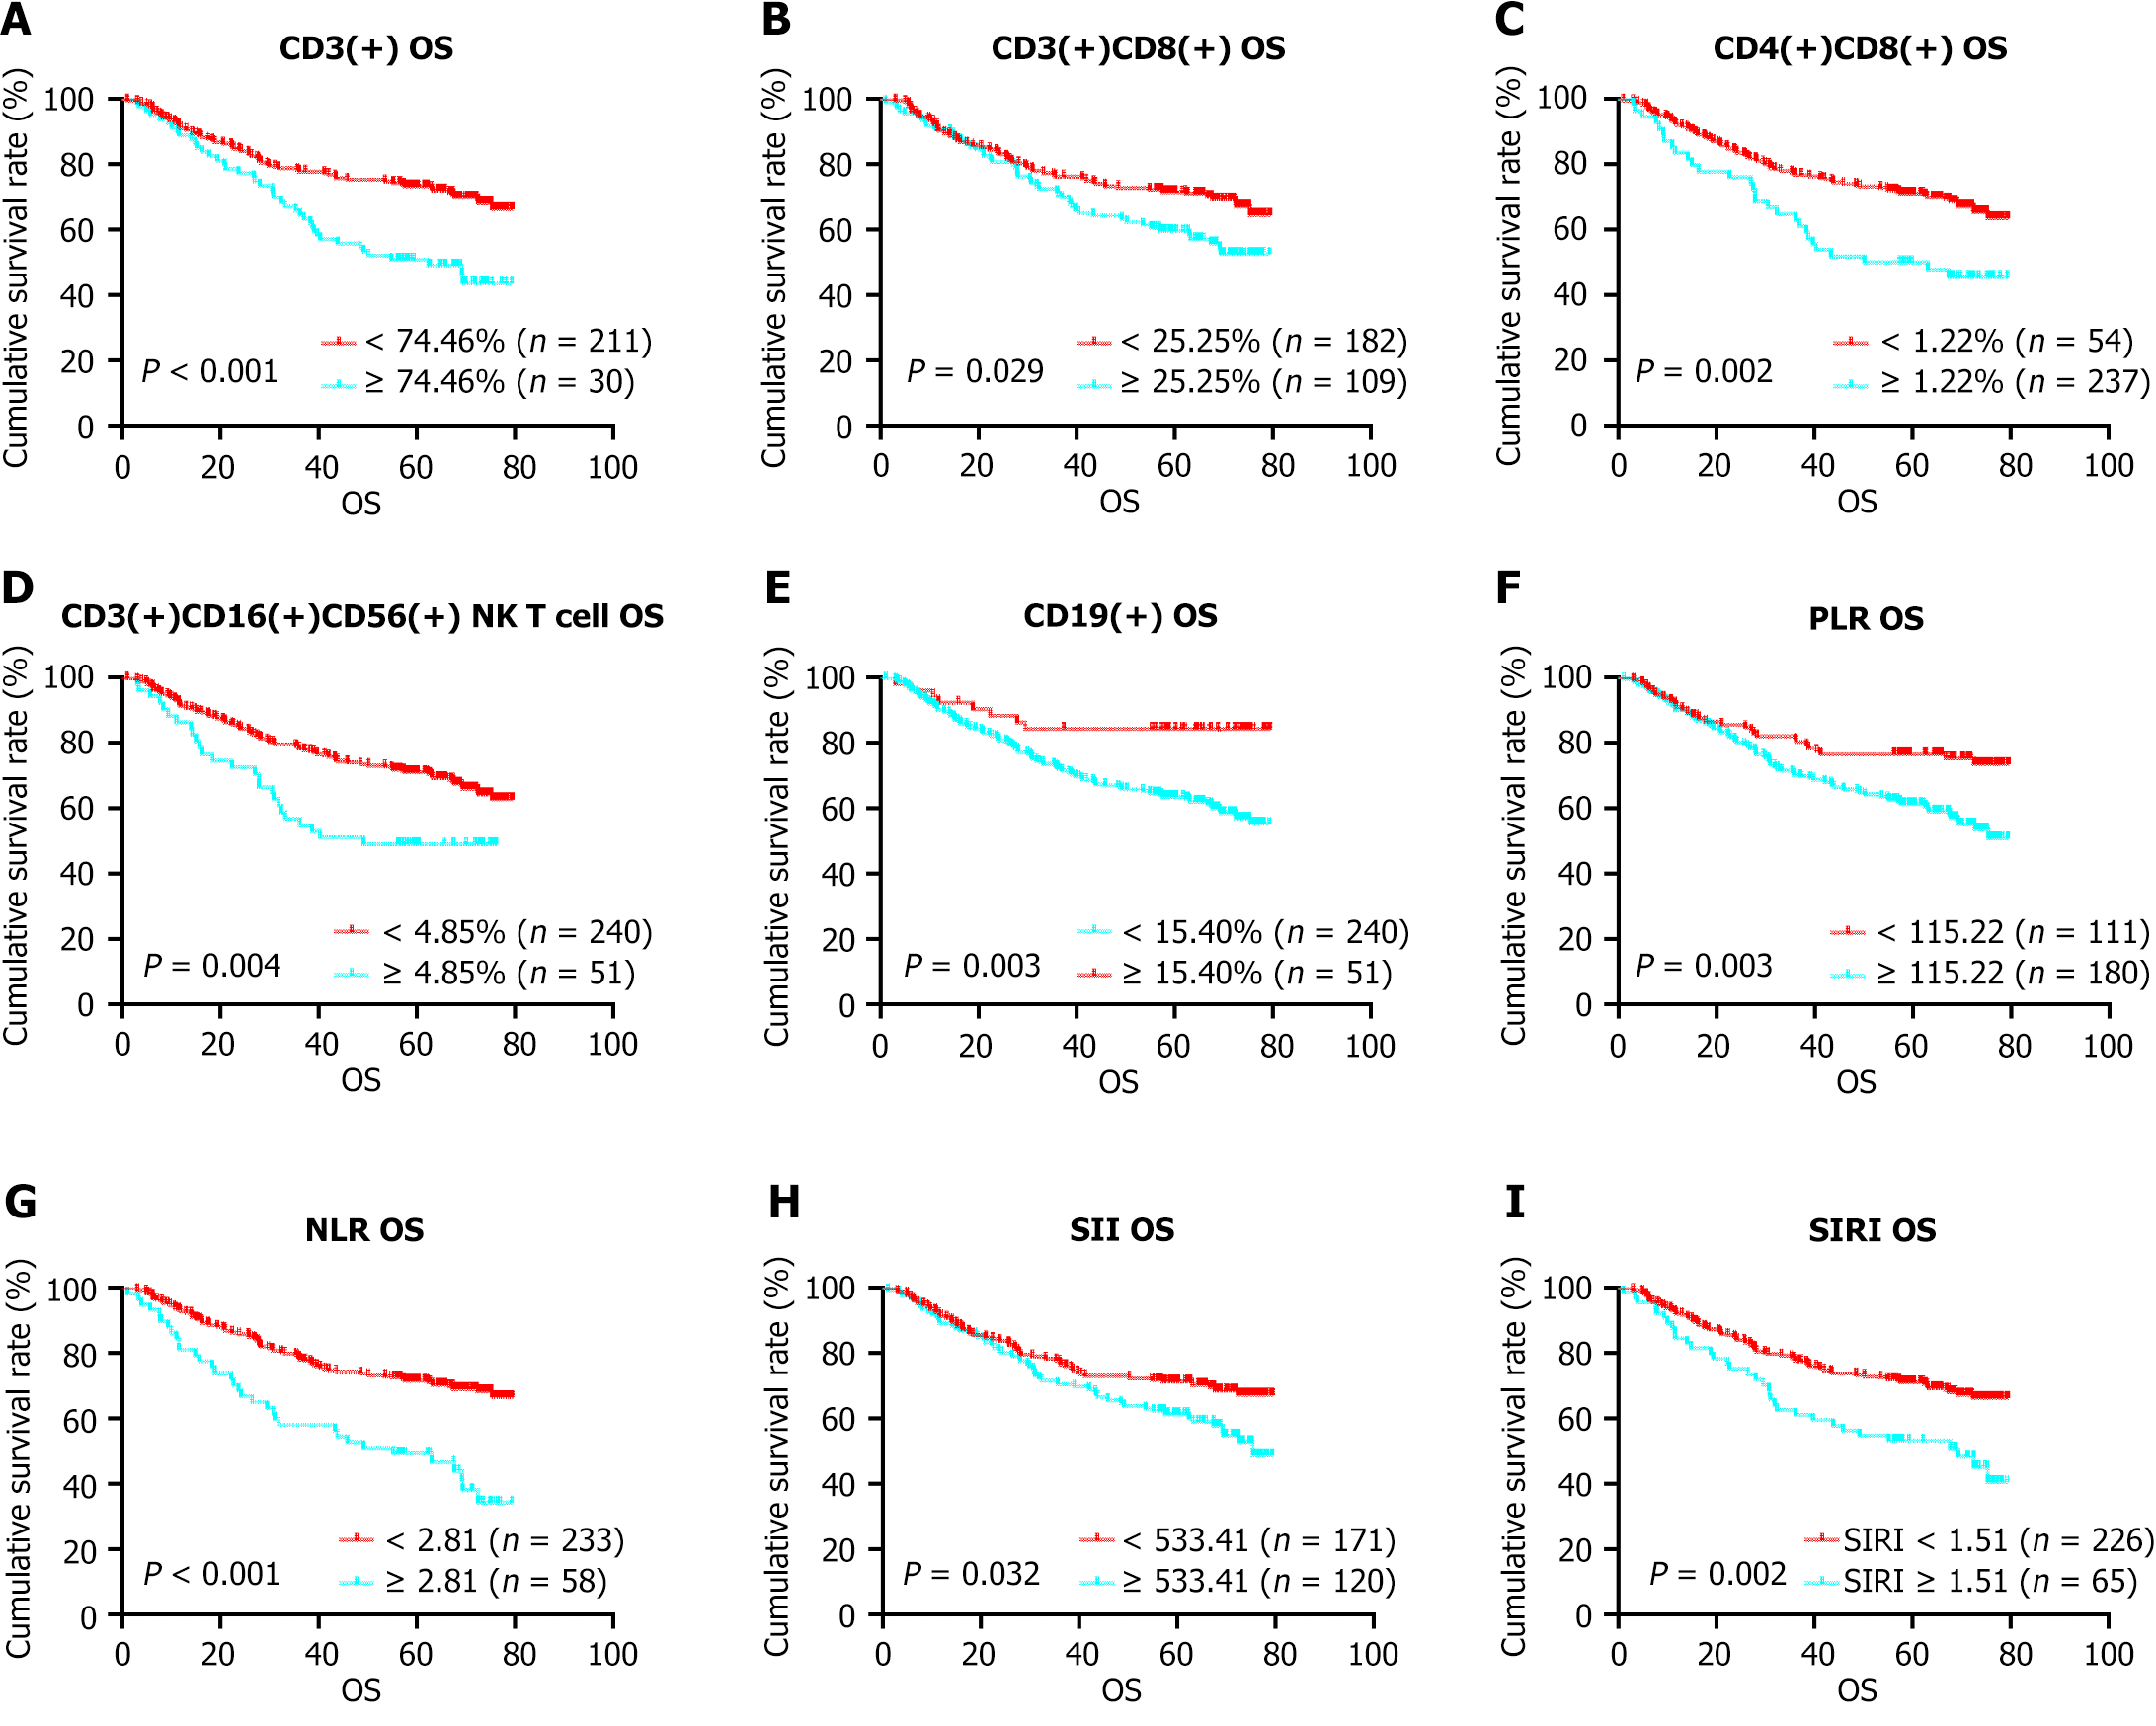
Figure 2 Kaplan–Meier curves for overall survival.
A: Overall survival by CD3(+) lymphocytes; B: OS by CD3(+)CD8(+) lymphocytes; C: OS by CD4(+)CD8(+) lymphocytes; D: OS by CD3(+)CD16(+)CD56(+) lymphocytes; E: OS by CD19(+) lymphocytes; F: OS by platelet-to-lymphocyte ratio; G: OS by neutrophil-to-lymphocyte ratio; H: OS by systemic immune inflammatory index; I: OS by systemic inflammation response index. PLR: Platelet-to-lymphocyte ratio; NLR: Neutrophil-to-lymphocyte ratio; SII: Systemic immune inflammatory index; SIRI: Systemic inflammation response index; PFS: Progression-free survival; OS: Overall survival.
- Citation: Ba ZC, Zhu XQ, Li ZG, Li YZ. Development and validation of a prognostic immunoinflammatory index for patients with gastric cancer. World J Gastroenterol 2024; 30(24): 3059-3075
- URL: https://www.wjgnet.com/1007-9327/full/v30/i24/3059.htm
- DOI: https://dx.doi.org/10.3748/wjg.v30.i24.3059


