Copyright
©The Author(s) 2024.
World J Gastroenterol. Jun 14, 2024; 30(22): 2881-2892
Published online Jun 14, 2024. doi: 10.3748/wjg.v30.i22.2881
Published online Jun 14, 2024. doi: 10.3748/wjg.v30.i22.2881
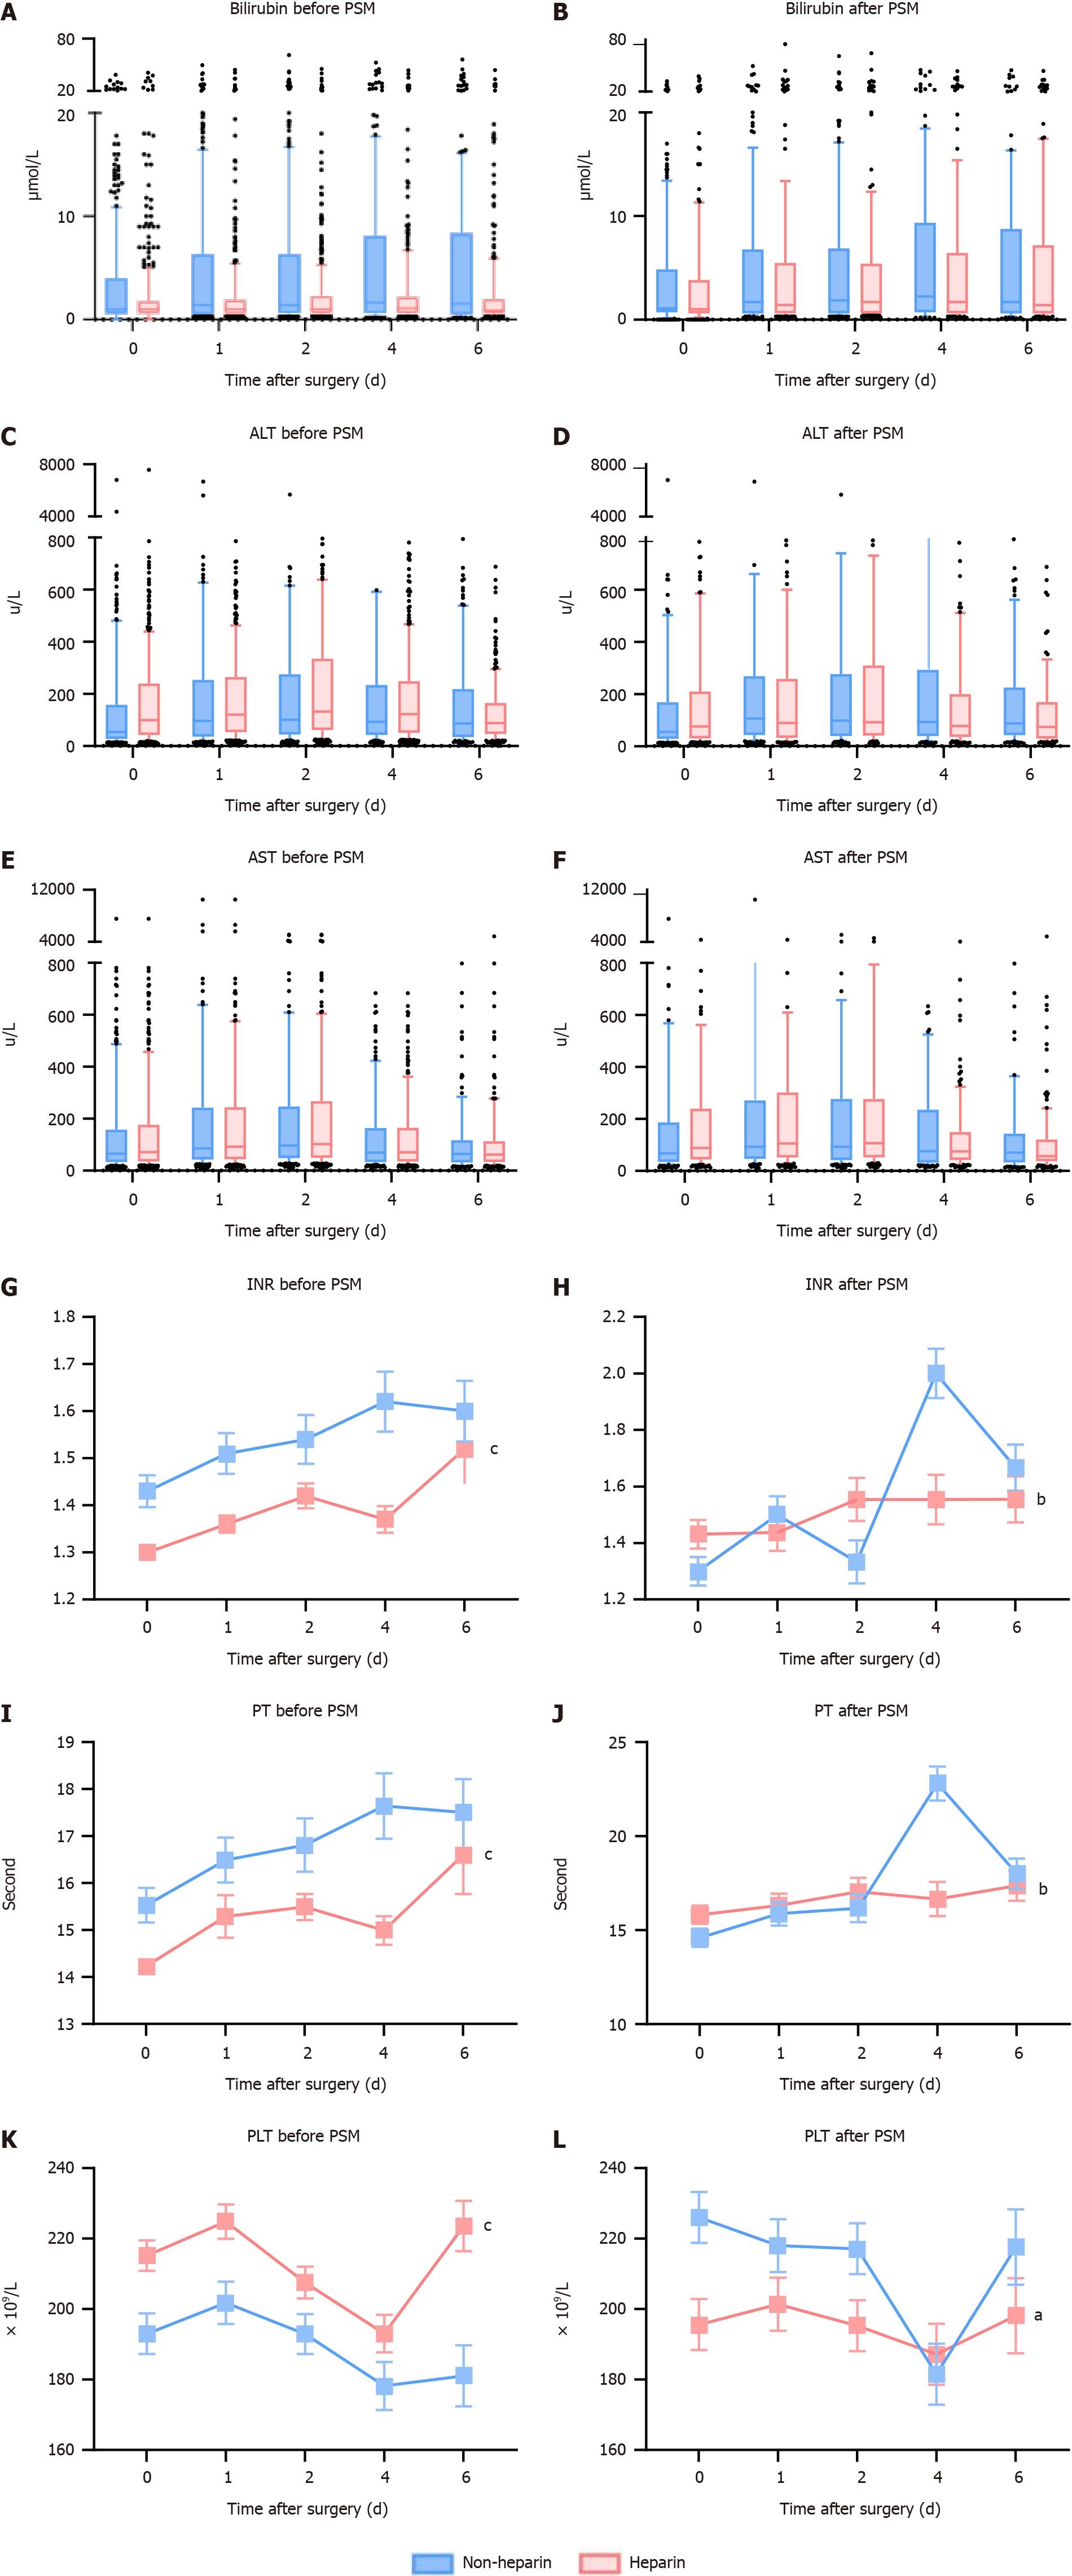
Figure 2 Baseline and postoperative liver function and coagulation results before and after propensity score matching.
A: Baseline total bilirubin levels in the heparin and non-heparin groups before propensity score matching (PSM); B: Baseline total bilirubin levels in the heparin and non-heparin groups after PSM; C: Baseline alanine transaminase (ALT) levels in the heparin and non-heparin groups before PSM; D: Baseline ALT levels in the heparin and non-heparin groups after PSM; E: Baseline aspartate transaminase (AST) levels in the heparin and non-heparin groups before PSM; F: Baseline AST levels in the heparin and non-heparin groups after PSM; G: Baseline international normalized ratio (INR) values in the heparin and non-heparin groups before PSM; H: Baseline INR values in the heparin and non-heparin groups after PSM; I: Baseline platelets (PLT) levels in the heparin and non-heparin groups before PSM; J: Baseline PLT levels in the heparin and non-heparin groups after PSM; K: Baseline prothrombin time (PT) levels in the heparin and non-heparin groups before PSM; L: Baseline PT levels in the heparin and non-heparin groups after PSM. aP < 0.05; bP < 0.01; cP < 0.001. PSM: Propensity score matching; AST: Aspartate transaminase; ALT: Alanine transaminase; INR: International normalized ratio; PLT: Platelets; PT: Prothrombin time.
- Citation: Xu ZY, Peng M, Fan MM, Zou QF, Li YR, Jiang D. Heparin is an effective treatment for preventing liver failure after hepatectomy. World J Gastroenterol 2024; 30(22): 2881-2892
- URL: https://www.wjgnet.com/1007-9327/full/v30/i22/2881.htm
- DOI: https://dx.doi.org/10.3748/wjg.v30.i22.2881


