Copyright
©The Author(s) 2024.
World J Gastroenterol. Jun 7, 2024; 30(21): 2777-2792
Published online Jun 7, 2024. doi: 10.3748/wjg.v30.i21.2777
Published online Jun 7, 2024. doi: 10.3748/wjg.v30.i21.2777
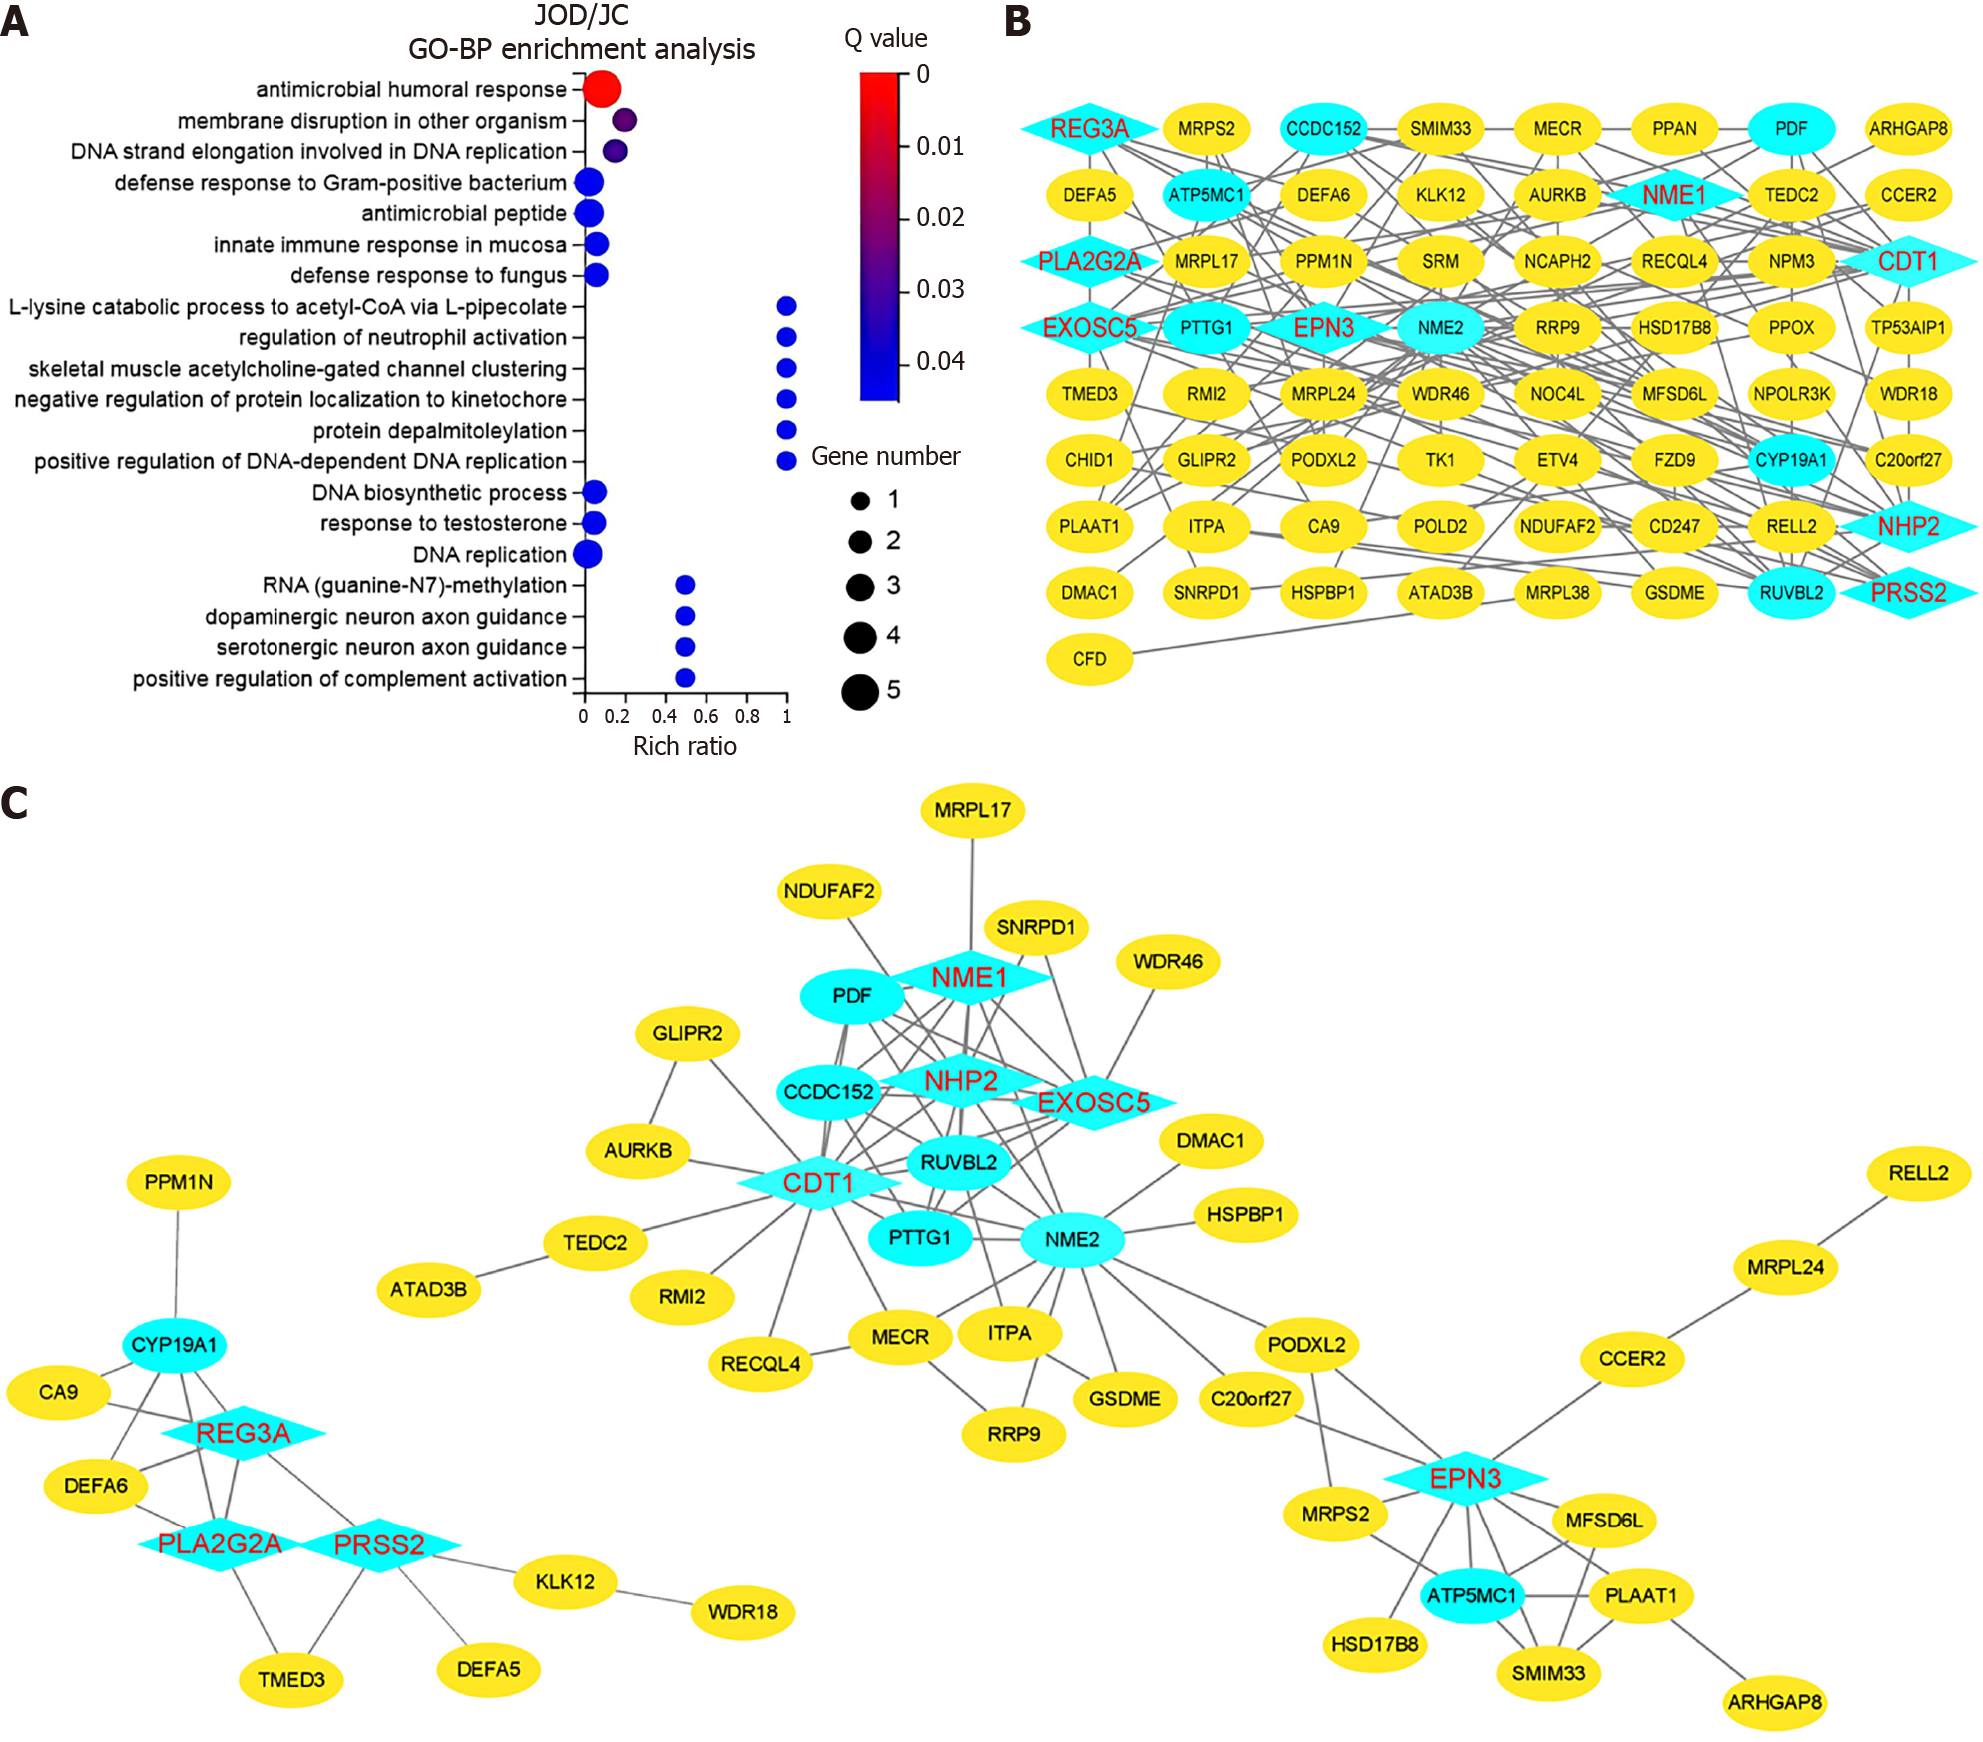
Figure 7 Functional enrichment analysis and identification of hub genes in the black module.
A: Gene Ontology-biological process enrichment analysis; B: Network of the 65 genes with the top 100 weighted values in the black module; C: Two major interaction networks. The blue nodes represent the candidate genes with a degree ≥ 5. The rhombic nodes represent the hub genes that are differentially expressed in the JOD group compared with the JC and JO groups. GO-BP: Gene Ontology-biological process.
- Citation: Niu XT, Wang XY, Wang Y, Han K, Ru N, Xiang JY, Linghu EQ. Transcriptome analysis suggests broad jejunal alterations in Linghu’s obesity-diarrhea syndrome: A pilot study. World J Gastroenterol 2024; 30(21): 2777-2792
- URL: https://www.wjgnet.com/1007-9327/full/v30/i21/2777.htm
- DOI: https://dx.doi.org/10.3748/wjg.v30.i21.2777


