Copyright
©The Author(s) 2024.
World J Gastroenterol. Jun 7, 2024; 30(21): 2777-2792
Published online Jun 7, 2024. doi: 10.3748/wjg.v30.i21.2777
Published online Jun 7, 2024. doi: 10.3748/wjg.v30.i21.2777
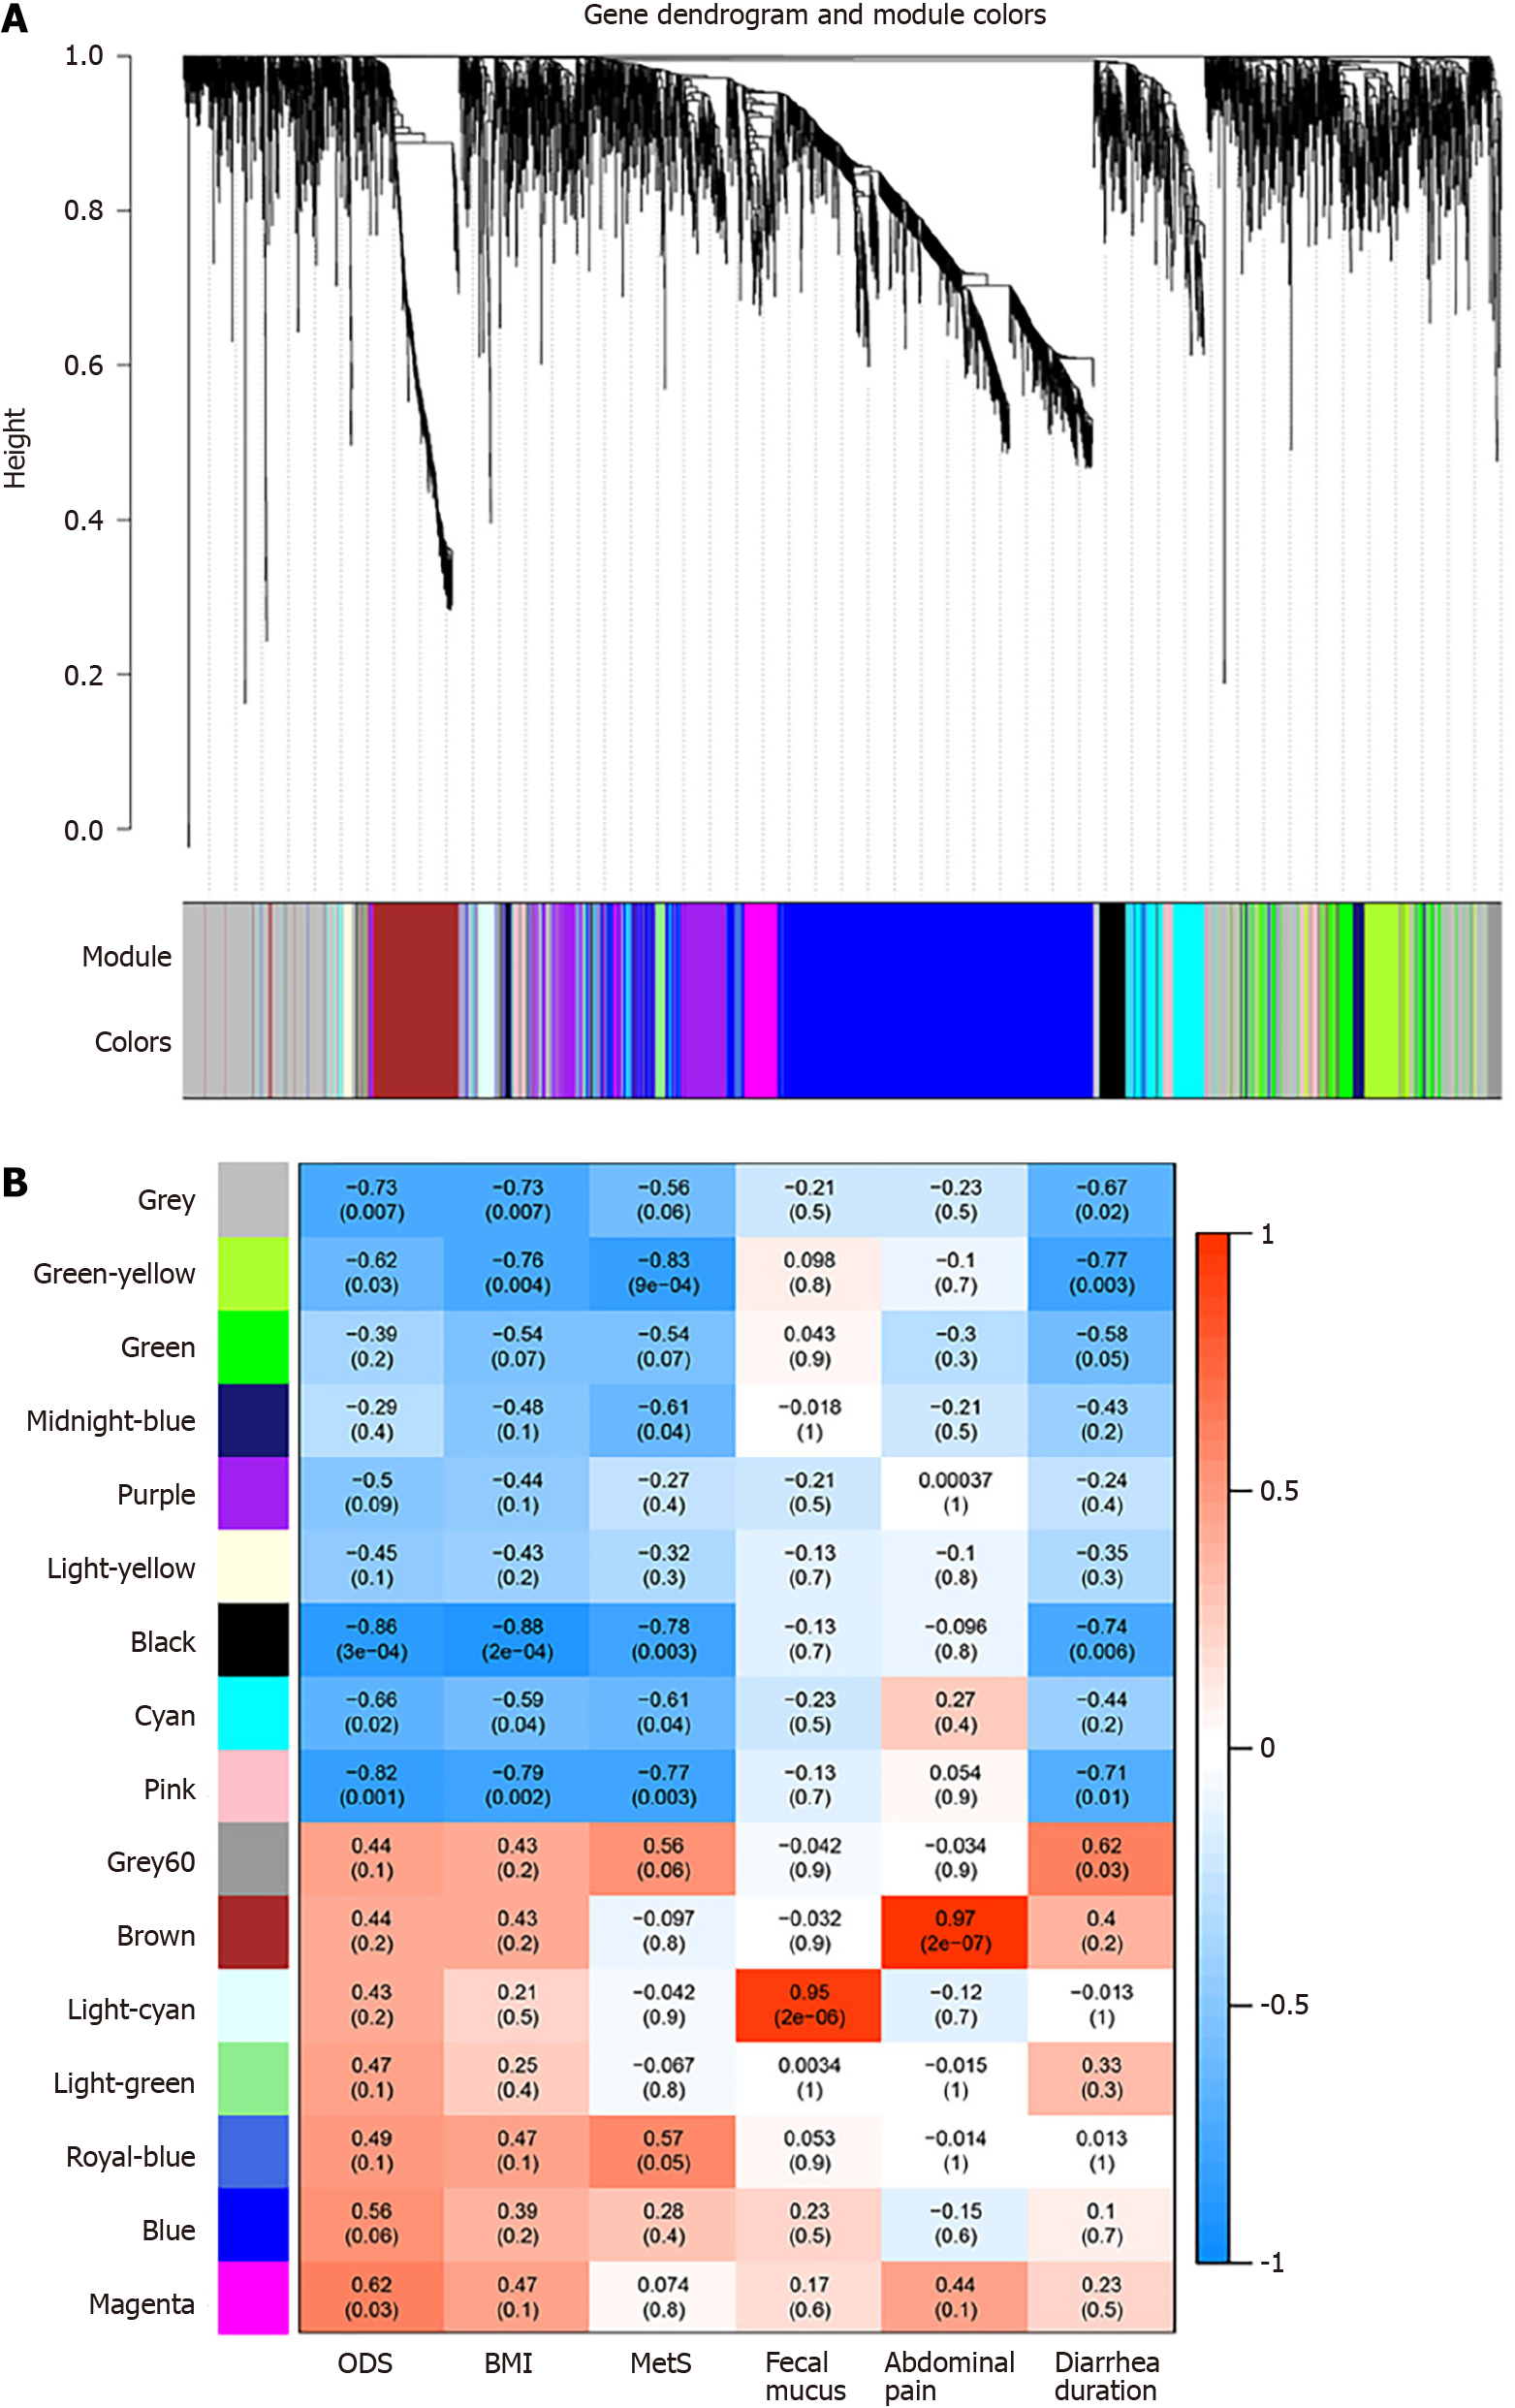
Figure 6 Identification of modules associated with the clinical traits of Linghu’s obesity-diarrhea syndrome.
A: Cluster dendrogram of co-expression network modules. The branches represent highly interconnected clusters of genes. The colors in the horizontal bar represent the co-expression modules; B: Heat map of the relationships between the module eigengenes and clinical traits. The horizontal axis corresponds to clinical traits. The colors of the vertical axis represent the co-expression modules. The color of each cell indicates the degree of correlation between the module and the clinical trait. In each cell, the number in the first row represents the Pearson correlation coefficient, and the number in the second row represents the P value of the correlation coefficient. ODS: Linghu’s obesity-diarrhea syndrome; BMI: Body mass index; MetS: Metabolic syndrome.
- Citation: Niu XT, Wang XY, Wang Y, Han K, Ru N, Xiang JY, Linghu EQ. Transcriptome analysis suggests broad jejunal alterations in Linghu’s obesity-diarrhea syndrome: A pilot study. World J Gastroenterol 2024; 30(21): 2777-2792
- URL: https://www.wjgnet.com/1007-9327/full/v30/i21/2777.htm
- DOI: https://dx.doi.org/10.3748/wjg.v30.i21.2777


