Copyright
©The Author(s) 2024.
World J Gastroenterol. Jun 7, 2024; 30(21): 2777-2792
Published online Jun 7, 2024. doi: 10.3748/wjg.v30.i21.2777
Published online Jun 7, 2024. doi: 10.3748/wjg.v30.i21.2777
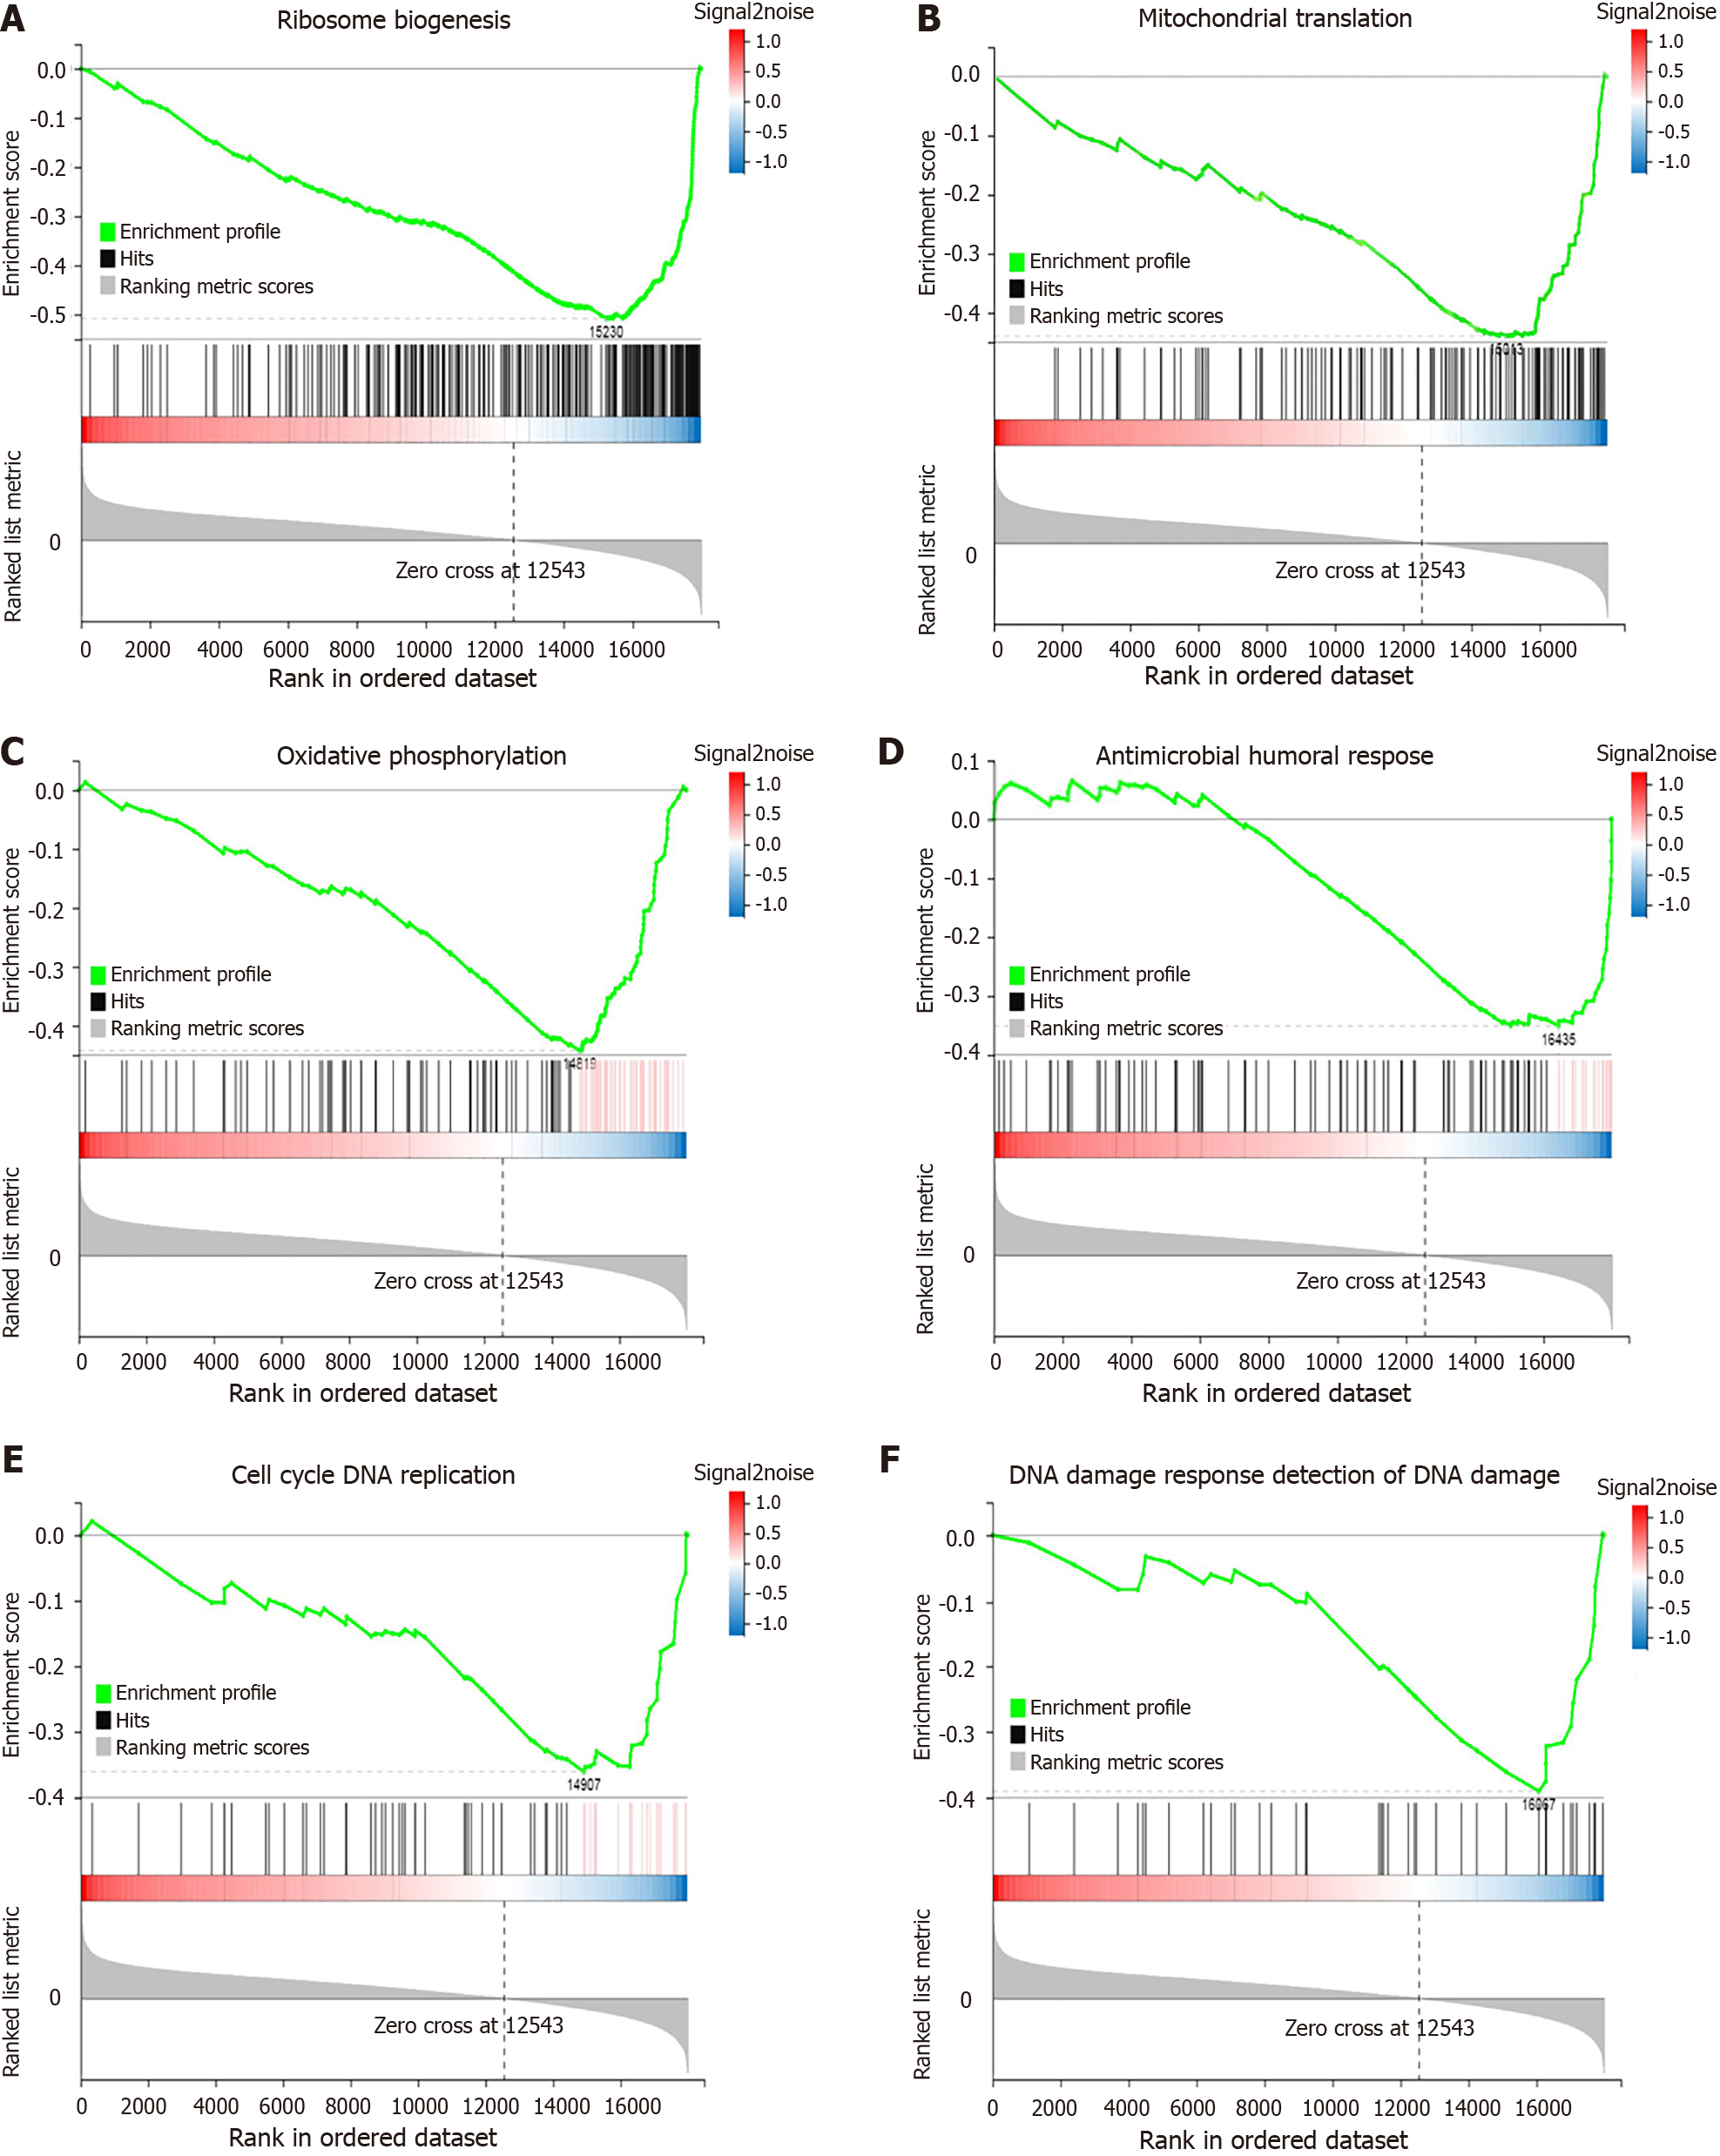
Figure 5 Gene set enrichment analysis of down-regulated biological processes in the JOD group.
A: Ribosome biogenesis; B: Mitochondrial translation; C: Oxidative phosphorylation; D: Antimicrobial humoral response; E: Cell cycle DNA replication; F: DNA damage response detection of DNA damage. Each figure is divided into three parts. The top half is the line diagram of the gene enrichment score (ES). The horizontal axis represents the genes in the gene set, and the vertical axis represents the ES value corresponding to each gene. The peak value < 0 indicates that the biological process is down-regulated. The middle part is the hits chart, and each bar represents a gene. The lower half is the rank value. The Signal2noise ratio corresponding to each gene is shown in the grey area map.
- Citation: Niu XT, Wang XY, Wang Y, Han K, Ru N, Xiang JY, Linghu EQ. Transcriptome analysis suggests broad jejunal alterations in Linghu’s obesity-diarrhea syndrome: A pilot study. World J Gastroenterol 2024; 30(21): 2777-2792
- URL: https://www.wjgnet.com/1007-9327/full/v30/i21/2777.htm
- DOI: https://dx.doi.org/10.3748/wjg.v30.i21.2777


