Copyright
©The Author(s) 2024.
World J Gastroenterol. Jun 7, 2024; 30(21): 2777-2792
Published online Jun 7, 2024. doi: 10.3748/wjg.v30.i21.2777
Published online Jun 7, 2024. doi: 10.3748/wjg.v30.i21.2777
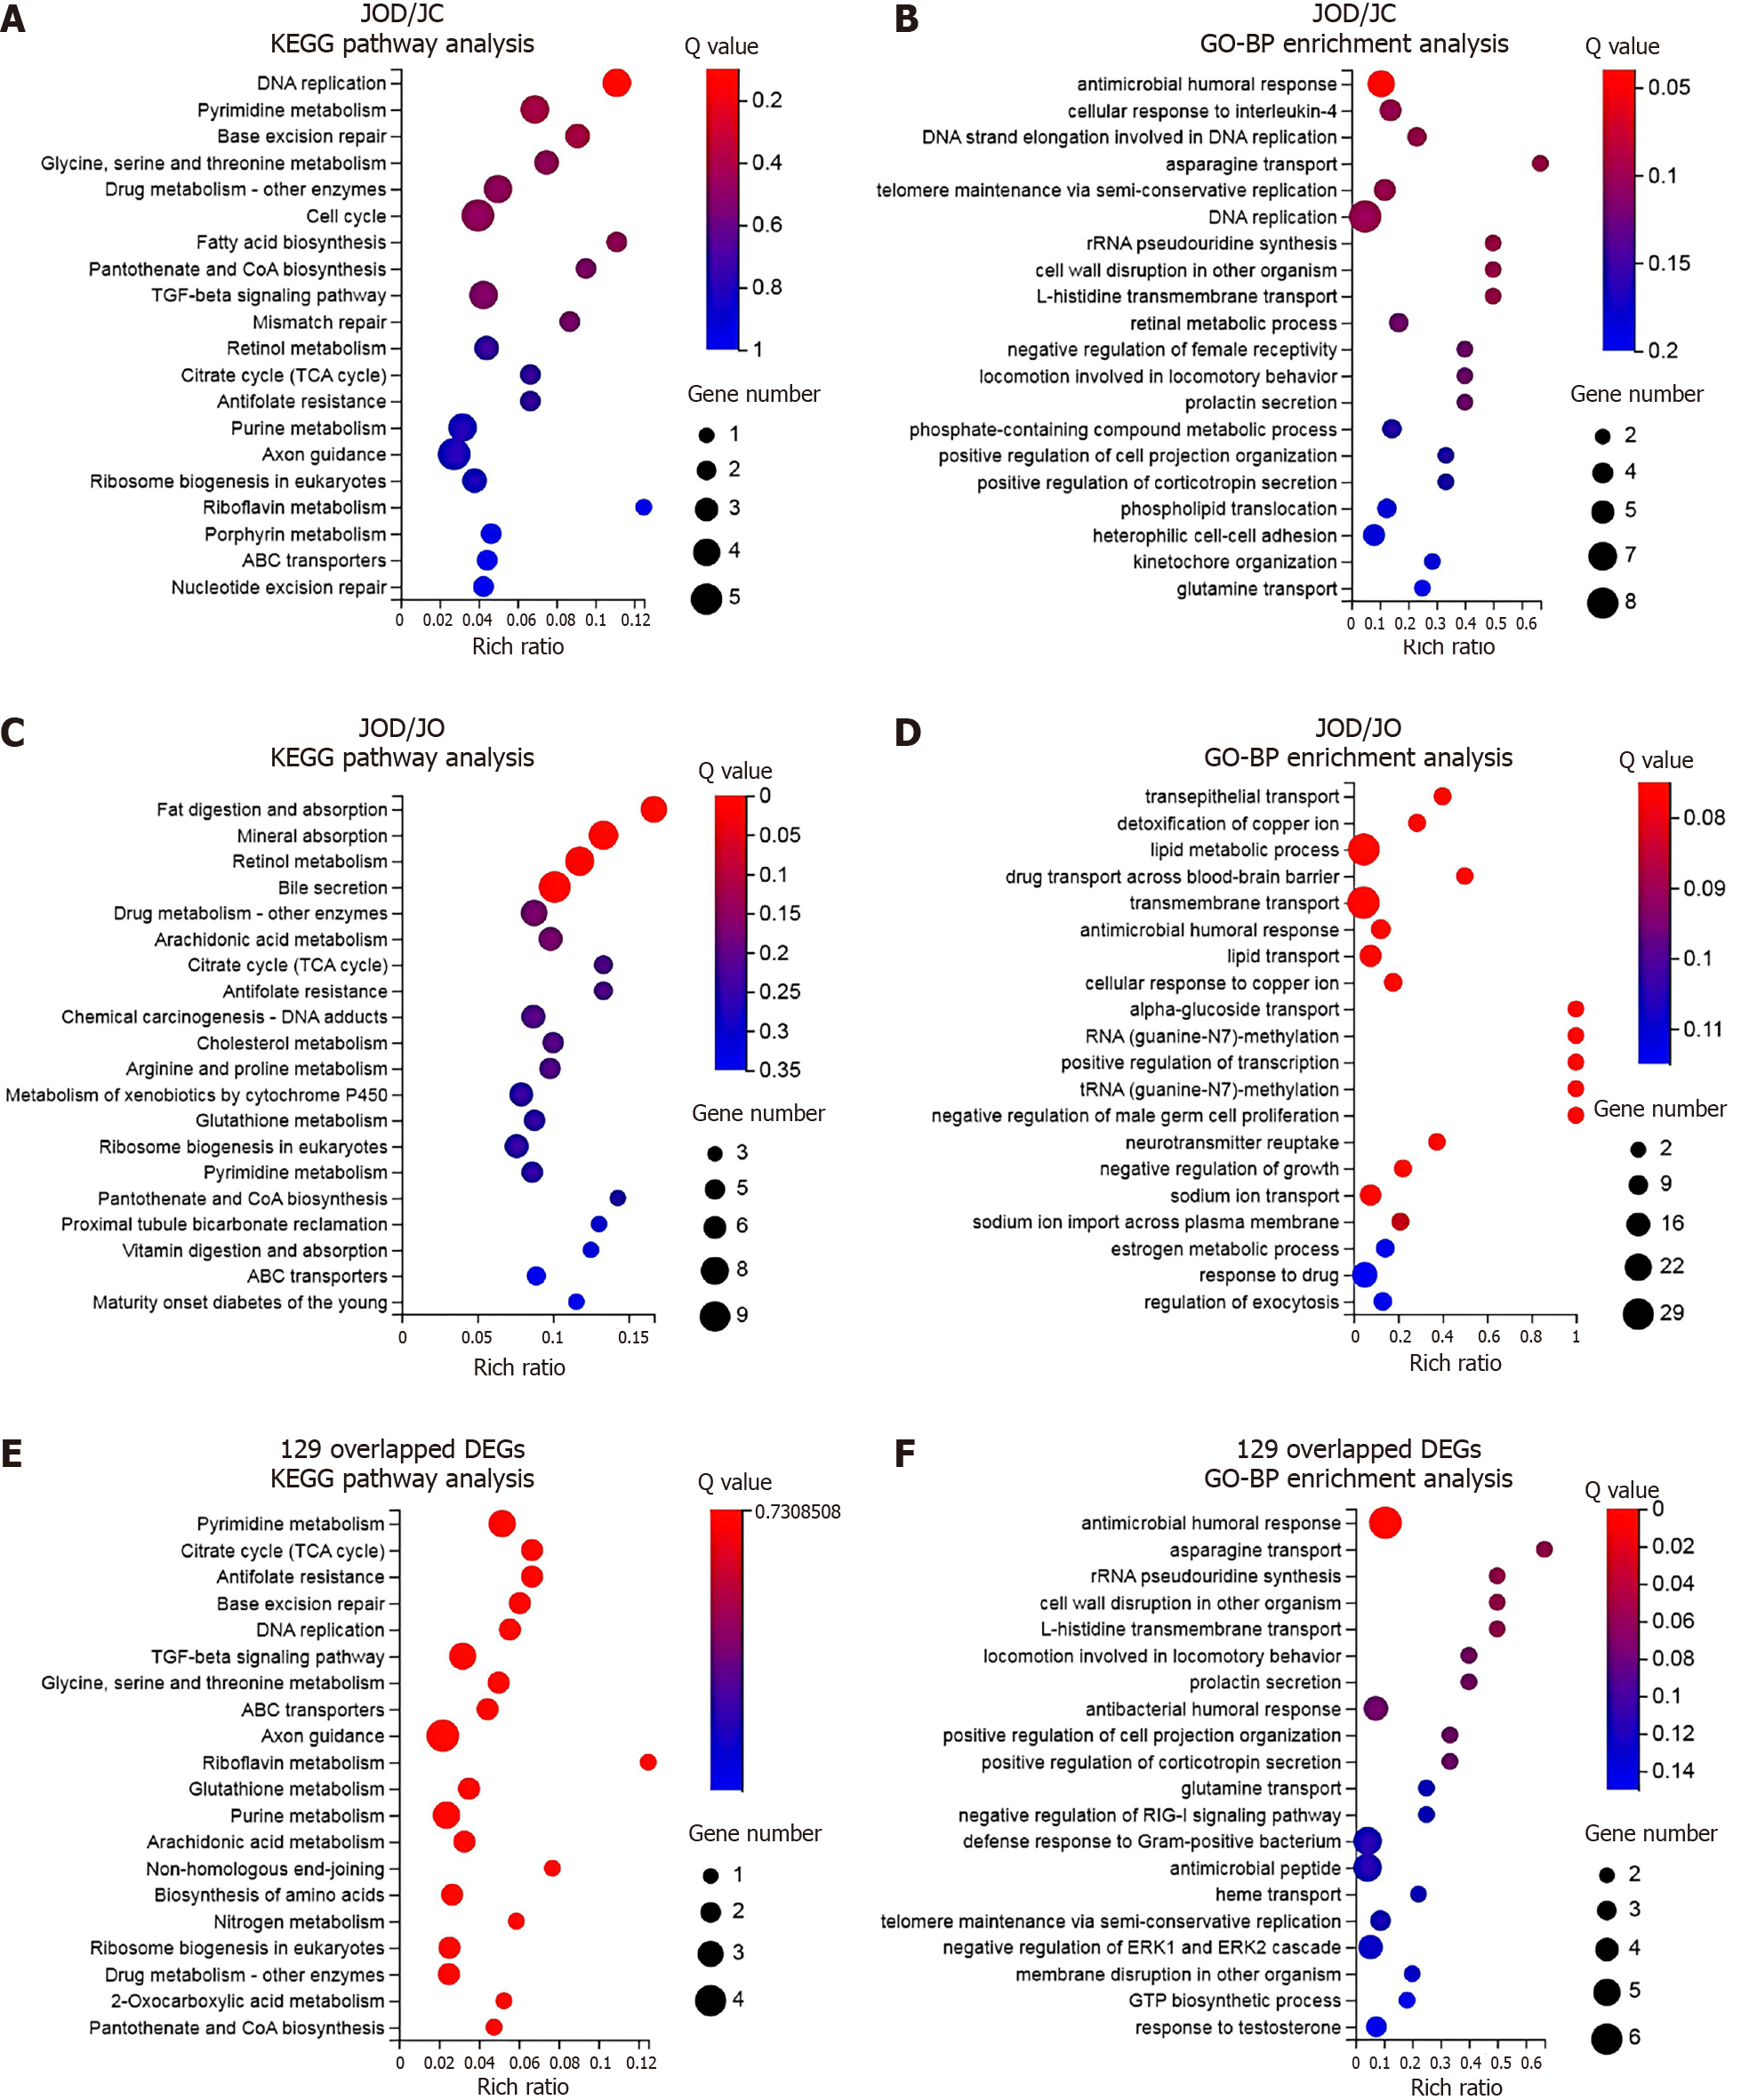
Figure 3 Functional and pathway enrichment analyses.
A: Kyoto Encyclopedia of Genes and Genomes (KEGG) pathway analysis based on the 211 differentially expressed genes (DEGs) between the JOD and JC groups; B: Gene Ontology-biological process (GO-BP) enrichment analysis based on the 211 DEGs between the JOD and JC groups; C: KEGG pathway analysis based on the 411 DEGs between the JOD and JO groups; D: GO-BP enrichment analysis based on the 411 DEGs between the JOD and JO groups; E: KEGG pathway analysis based on the 129 overlapped DEGs; F: GO-BP enrichment analysis based on the 129 overlapped DEGs. Bubble charts show the top 20 significantly enriched terms. The color of the bubbles represents the Q value of each enriched term, and the size of the bubbles represents the number of DEGs enriched in the term. The horizontal axis indicates the rich ratio of the number of DEGs enriched in the term to the total number of human genes annotated to this term. KEGG: Kyoto Encyclopedia of Genes and Genomes; GO-BP: Gene Ontology-biological process.
- Citation: Niu XT, Wang XY, Wang Y, Han K, Ru N, Xiang JY, Linghu EQ. Transcriptome analysis suggests broad jejunal alterations in Linghu’s obesity-diarrhea syndrome: A pilot study. World J Gastroenterol 2024; 30(21): 2777-2792
- URL: https://www.wjgnet.com/1007-9327/full/v30/i21/2777.htm
- DOI: https://dx.doi.org/10.3748/wjg.v30.i21.2777


