Copyright
©The Author(s) 2024.
World J Gastroenterol. Jun 7, 2024; 30(21): 2777-2792
Published online Jun 7, 2024. doi: 10.3748/wjg.v30.i21.2777
Published online Jun 7, 2024. doi: 10.3748/wjg.v30.i21.2777
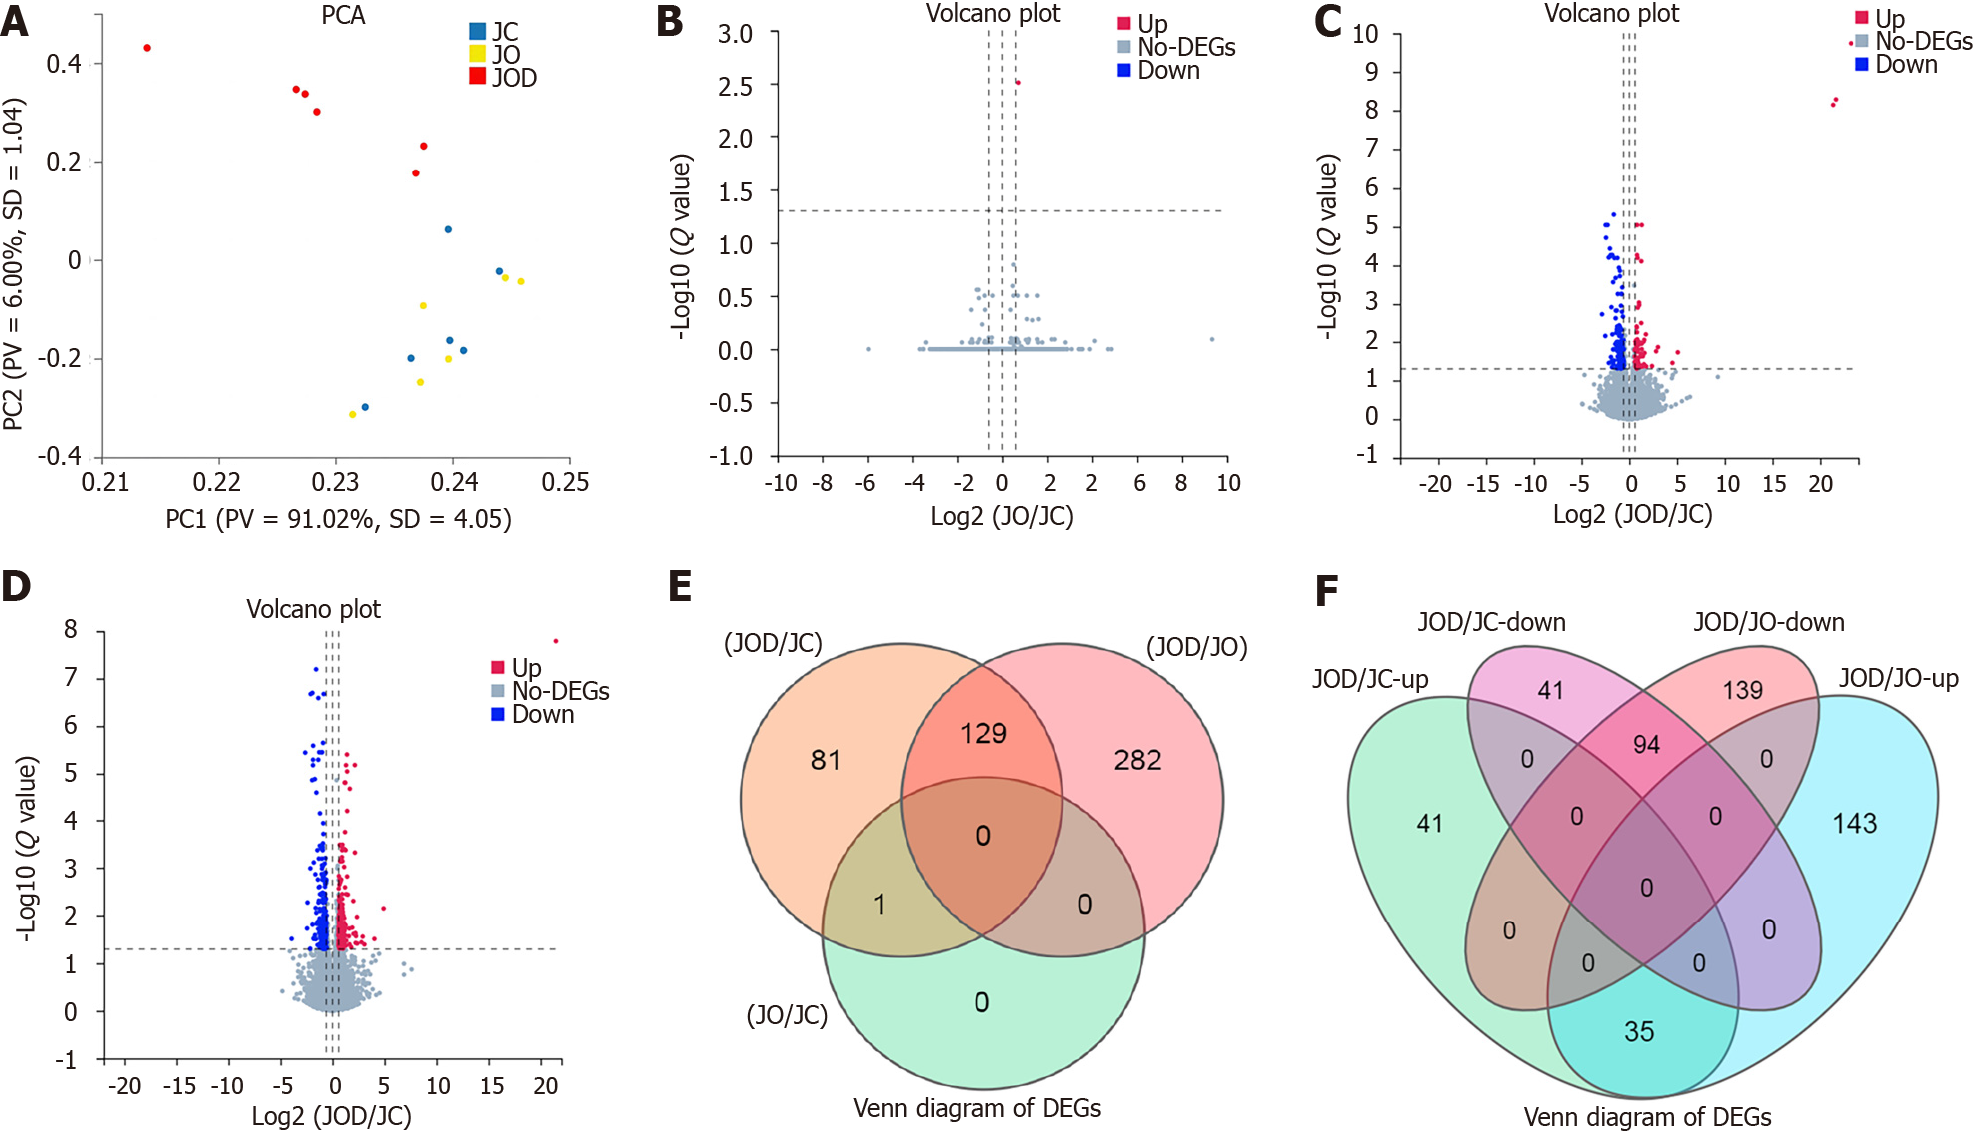
Figure 2 Transcriptomic differences.
A: Principal component analysis for all samples. Each point represents a sample; B: Volcano plot for the JO and JC groups; C: Volcano plot for the JOD and JC groups; D: Volcano plot for the JOD and JO groups. In the volcano plots, each gene is represented by a single node, and its expression level is indicated by color, with no significant differential expression in grey, significant up-regulation in red, and significant down-regulation in blue. The threshold of differentially expressed genes (DEGs) is |log2fold change| (|log2FC|) ≥ 0.585 and a P-adjusted value (Q value) < 0.05; E: Venn diagram for DEGs among the three groups; F: Venn diagram for DEGs in the JOD group compared with the JC and JO groups. All overlapped DEGs changed in the same direction in the JOD group, with 94 down-regulated and 35 up-regulated. PCA: Principal component analysis; DEGs: Differentially expressed genes.
- Citation: Niu XT, Wang XY, Wang Y, Han K, Ru N, Xiang JY, Linghu EQ. Transcriptome analysis suggests broad jejunal alterations in Linghu’s obesity-diarrhea syndrome: A pilot study. World J Gastroenterol 2024; 30(21): 2777-2792
- URL: https://www.wjgnet.com/1007-9327/full/v30/i21/2777.htm
- DOI: https://dx.doi.org/10.3748/wjg.v30.i21.2777


