Copyright
©The Author(s) 2024.
World J Gastroenterol. May 21, 2024; 30(19): 2575-2602
Published online May 21, 2024. doi: 10.3748/wjg.v30.i19.2575
Published online May 21, 2024. doi: 10.3748/wjg.v30.i19.2575
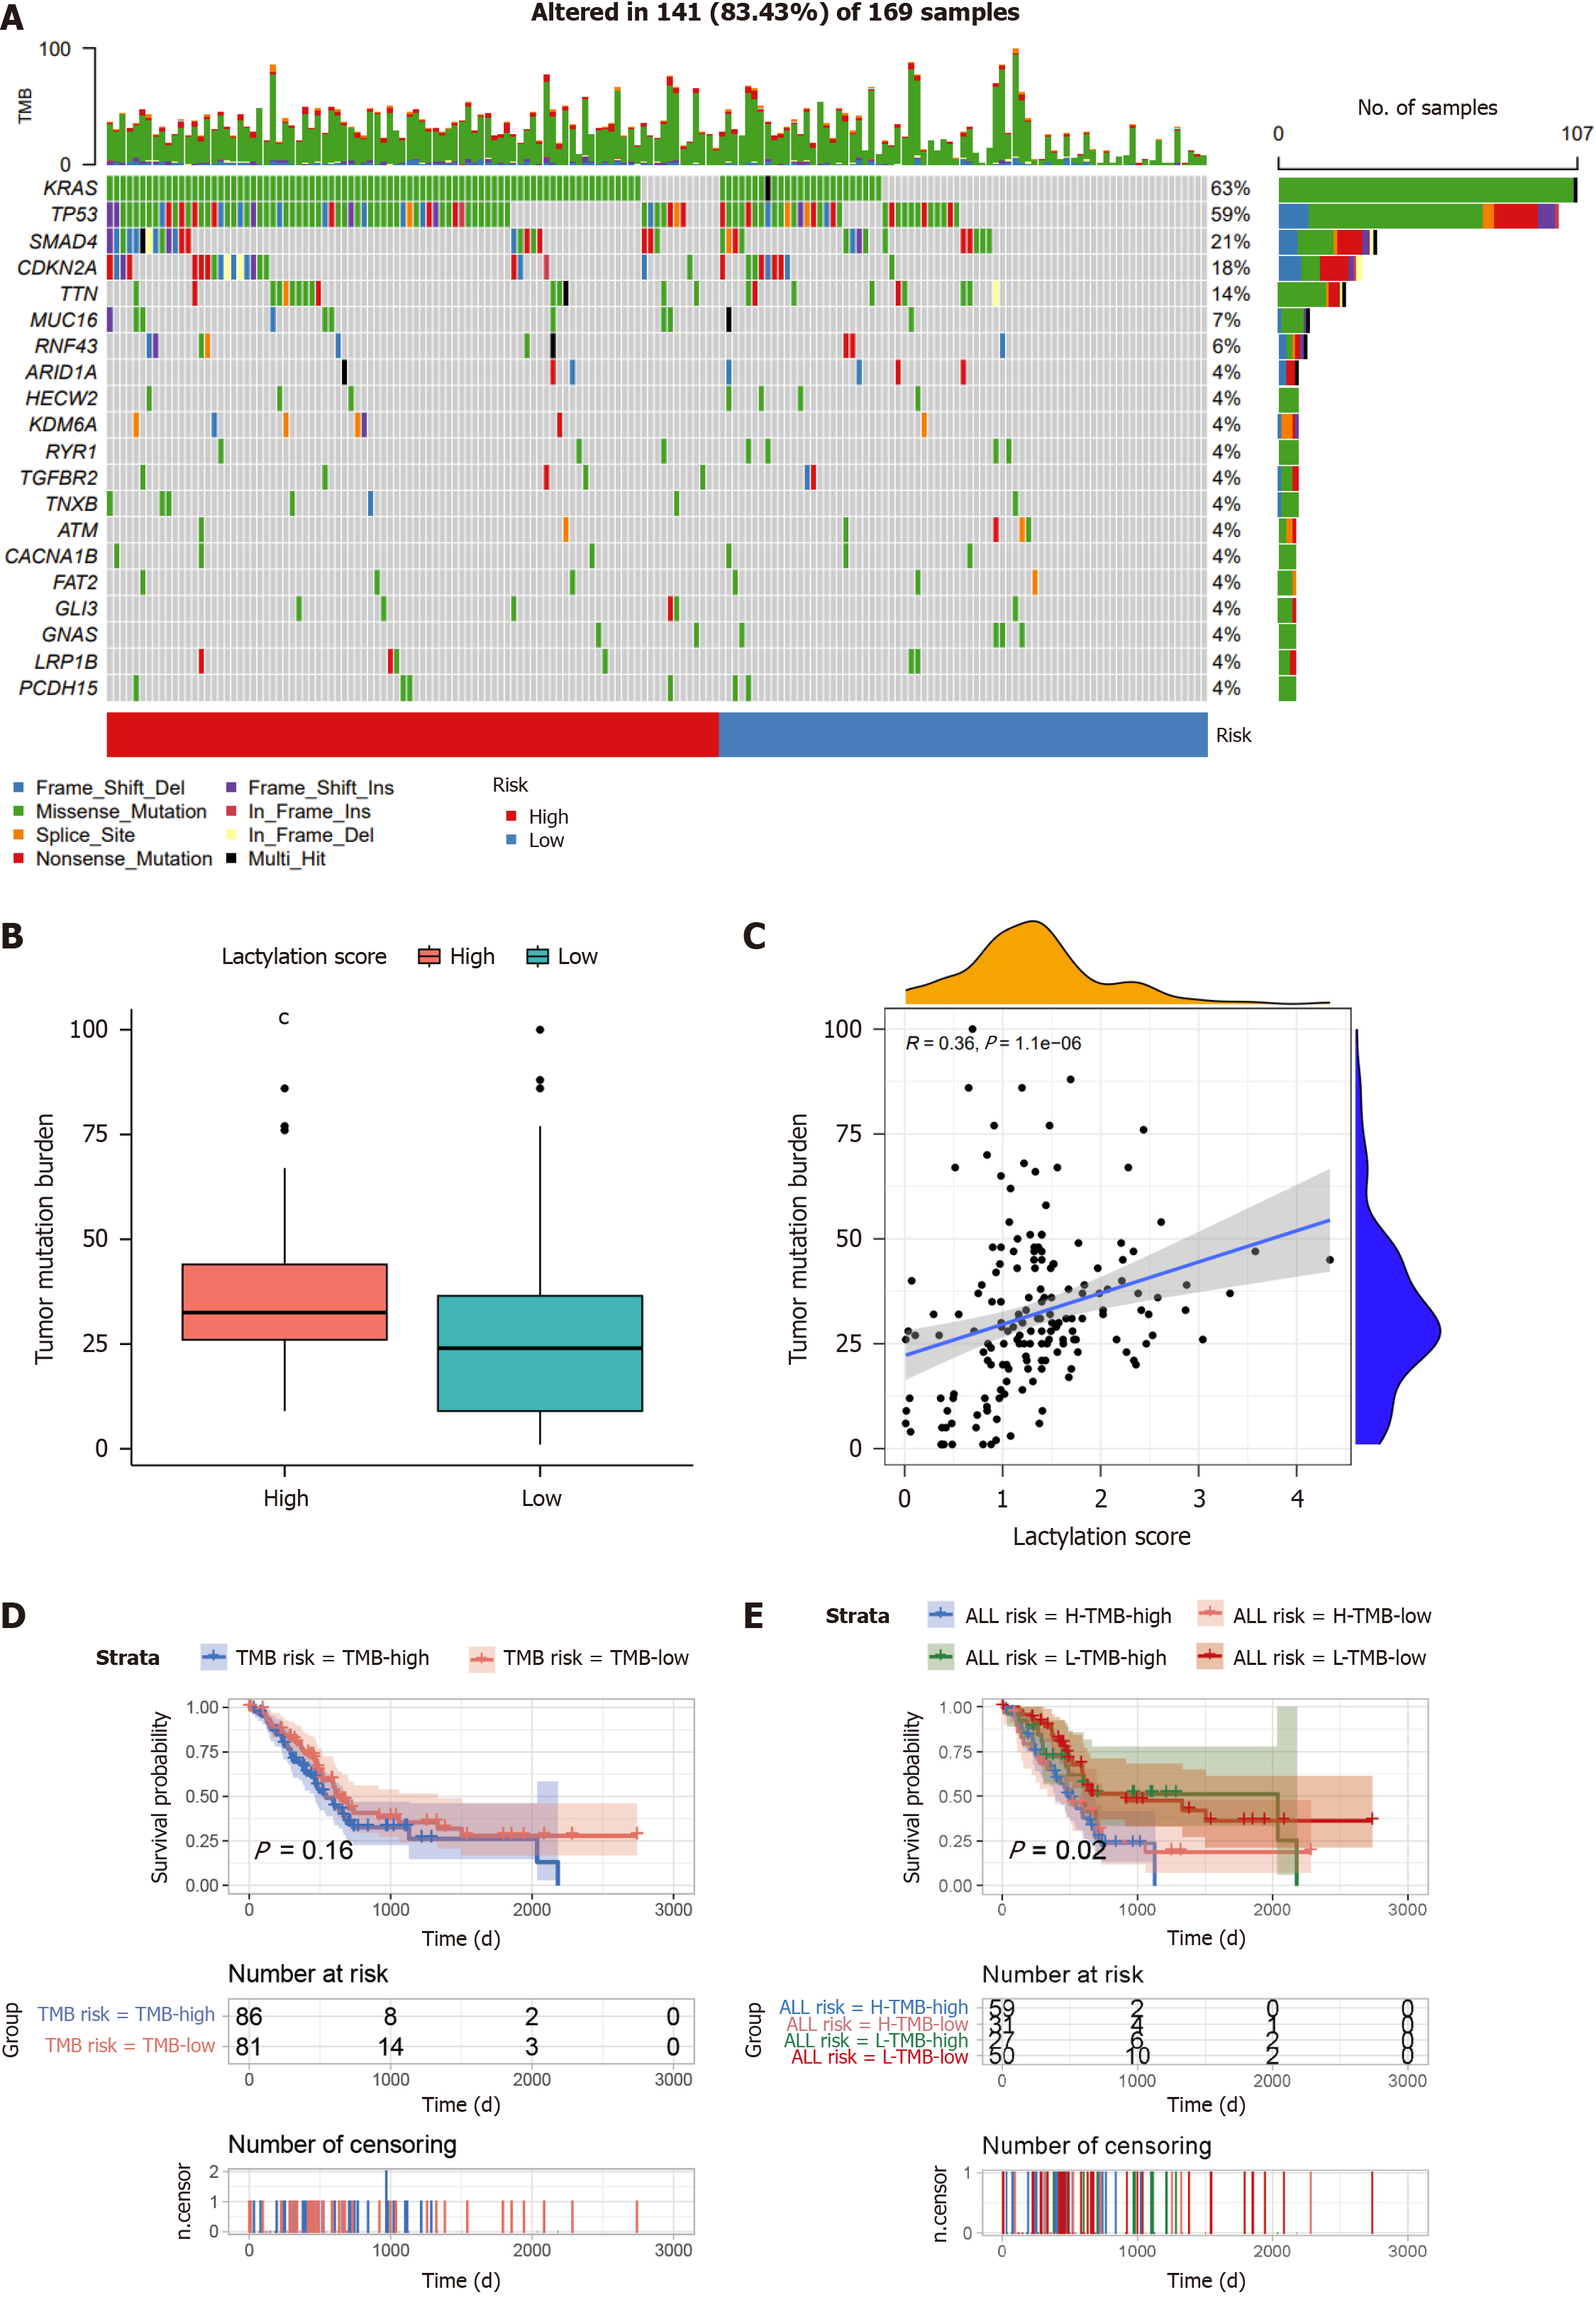
Figure 7 Comprehensive analysis of the lactylation score in pancreatic ductal adenocarcinoma.
A: The waterfall plot of somatic mutation features between subgroups; B: Tumor mutation burden (TMB) between different groups; C: Correlation analysis of TMB and lactylation score; D: Kaplan-Meier survival analysis of TMB; E: Kaplan-Meier survival analysis of TMB combined with lactylation score. cP < 0.001.
- Citation: Peng T, Sun F, Yang JC, Cai MH, Huai MX, Pan JX, Zhang FY, Xu LM. Novel lactylation-related signature to predict prognosis for pancreatic adenocarcinoma. World J Gastroenterol 2024; 30(19): 2575-2602
- URL: https://www.wjgnet.com/1007-9327/full/v30/i19/2575.htm
- DOI: https://dx.doi.org/10.3748/wjg.v30.i19.2575


