Copyright
©The Author(s) 2024.
World J Gastroenterol. May 21, 2024; 30(19): 2575-2602
Published online May 21, 2024. doi: 10.3748/wjg.v30.i19.2575
Published online May 21, 2024. doi: 10.3748/wjg.v30.i19.2575
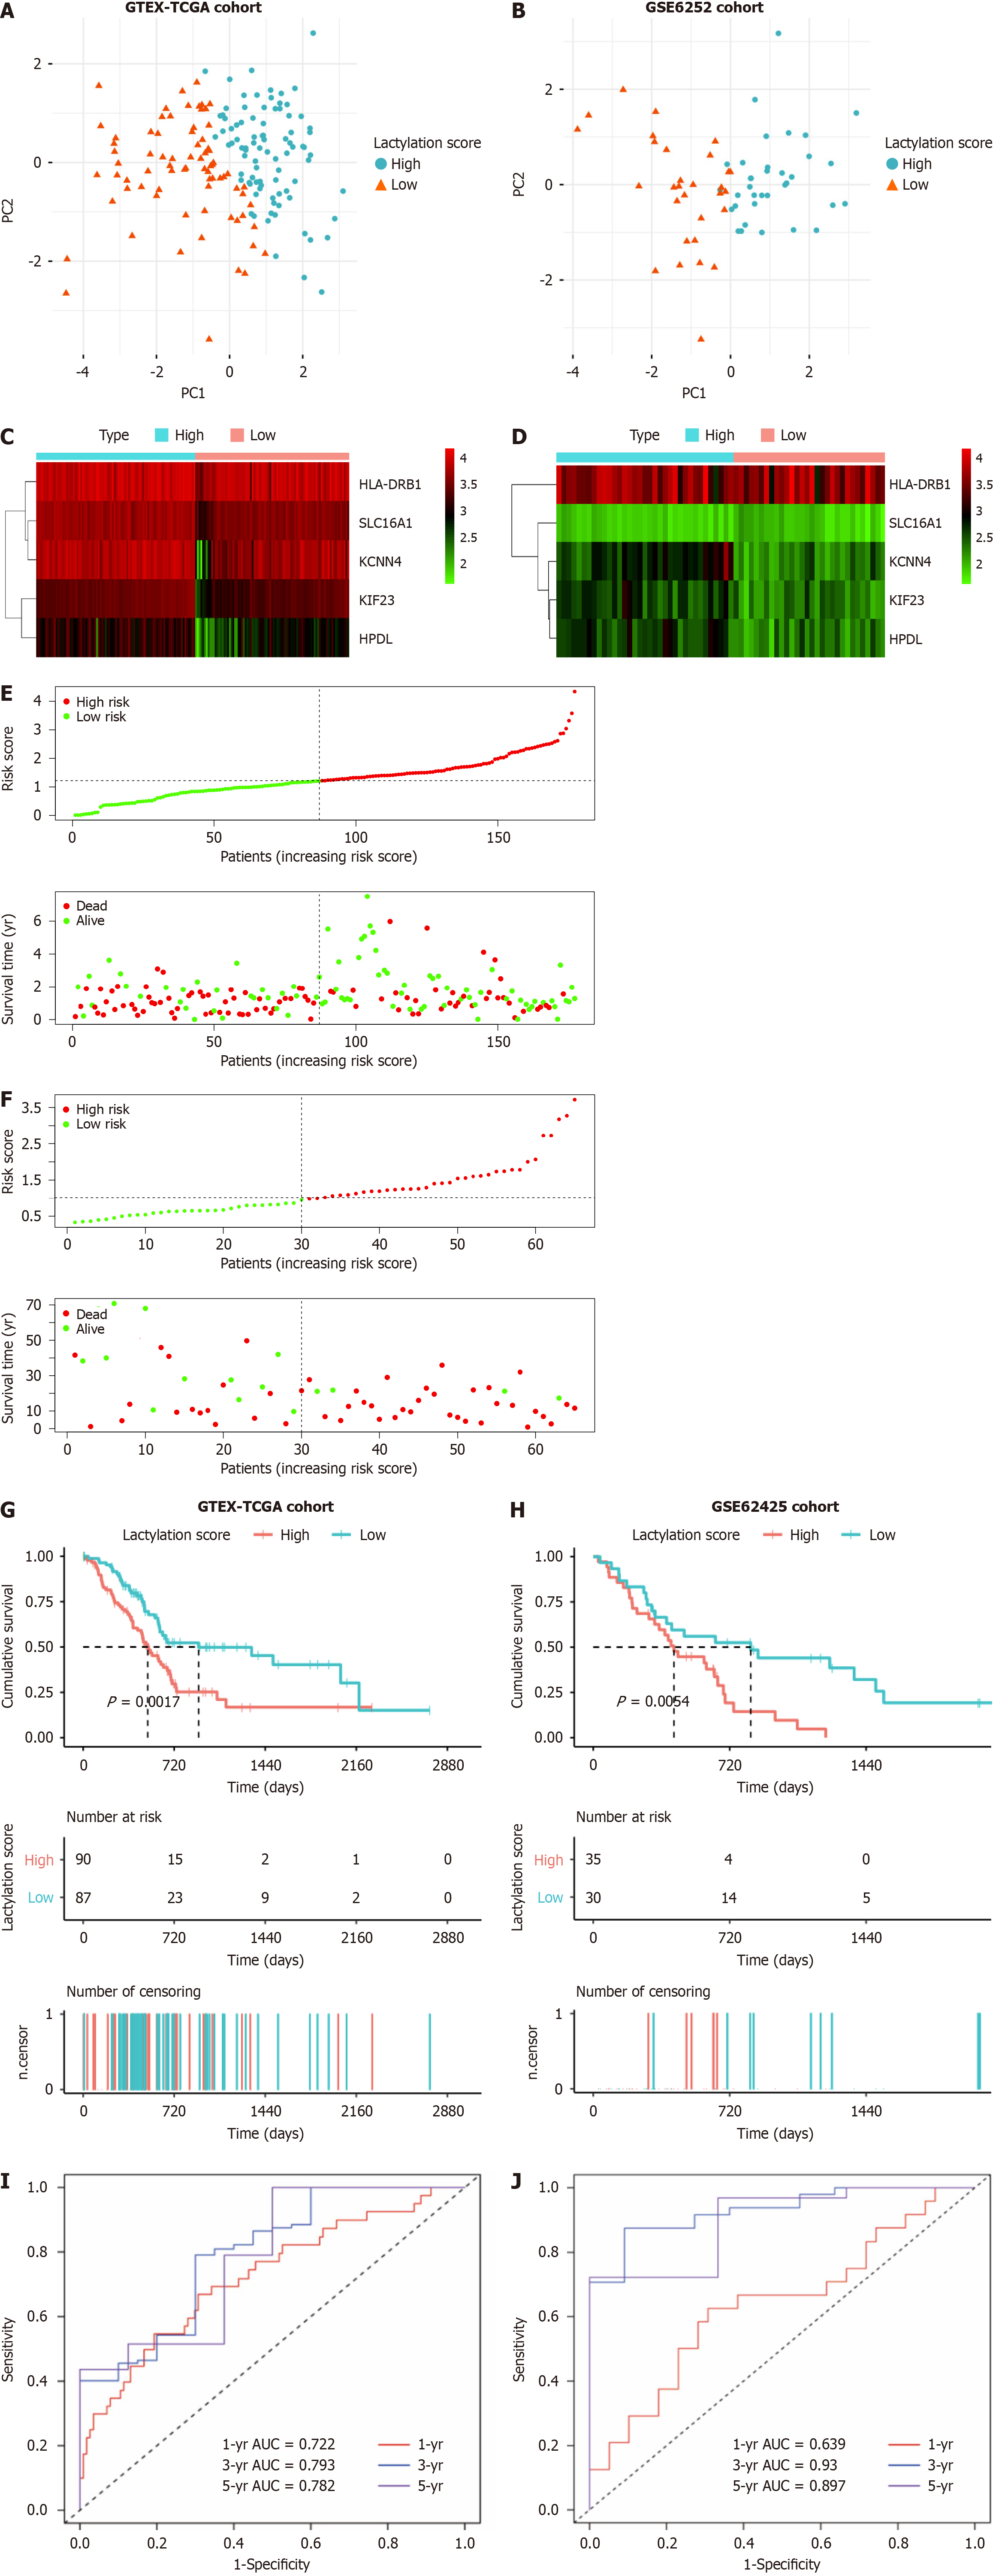
Figure 3 Prognostic value of lactylation-related genes in pancreatic ductal adenocarcinoma.
A and B: Principal component analysis was used to assess the accuracy of subgroups based on the lactylation score in training and validation sets; C and D: Heatmap for the expression of the prognostic lactylation-related genes (LRGs) of two groups in the training set and validation set; E and F: The distribution of lactylation score and survival status of the patients with pancreatic ductal adenocarcinoma with increasing scores in two sets; G and H: Kaplan-Meier survival analysis between lactylation score-low and lactylation score-high groups in two sets; I and J: Receiver operating characteristic curves analysis of LRGs on overall survival at 1 year, 3 years, and 5 years in two sets. AUC: The area under curve.
- Citation: Peng T, Sun F, Yang JC, Cai MH, Huai MX, Pan JX, Zhang FY, Xu LM. Novel lactylation-related signature to predict prognosis for pancreatic adenocarcinoma. World J Gastroenterol 2024; 30(19): 2575-2602
- URL: https://www.wjgnet.com/1007-9327/full/v30/i19/2575.htm
- DOI: https://dx.doi.org/10.3748/wjg.v30.i19.2575


