Copyright
©The Author(s) 2024.
World J Gastroenterol. May 21, 2024; 30(19): 2553-2563
Published online May 21, 2024. doi: 10.3748/wjg.v30.i19.2553
Published online May 21, 2024. doi: 10.3748/wjg.v30.i19.2553
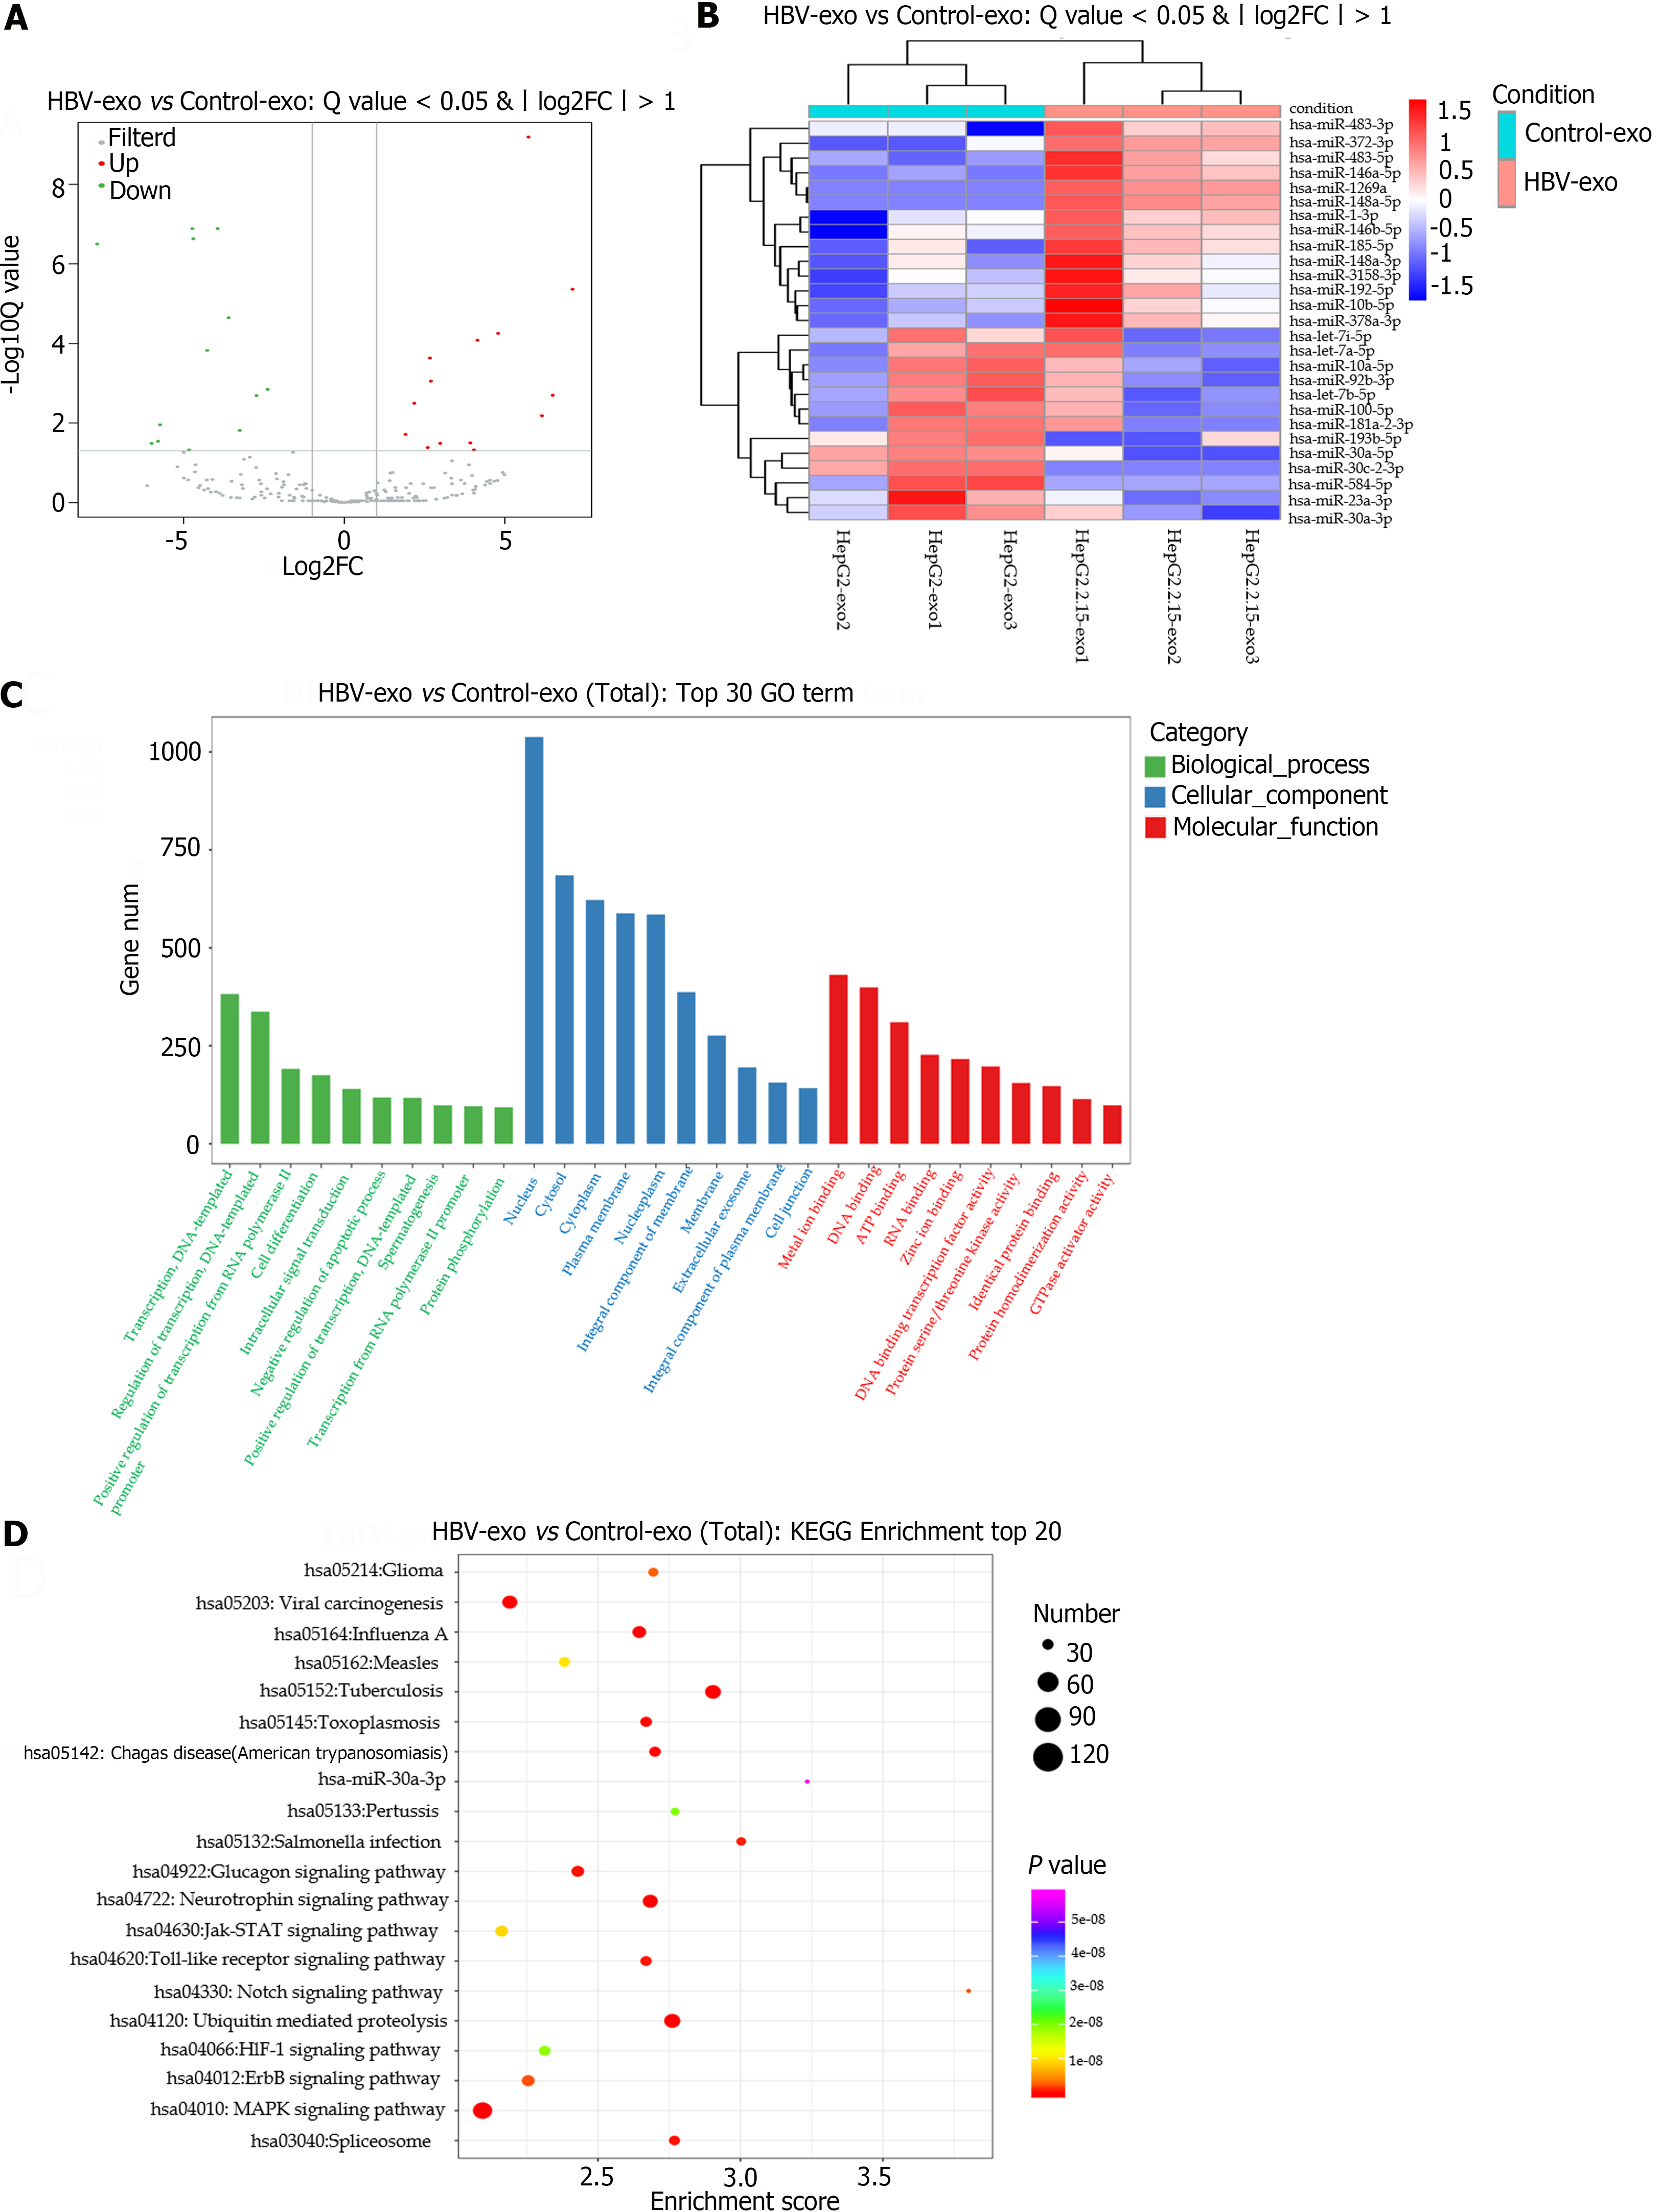
Figure 4 Differential miRNA expression in HepG2.
2.15-derived exosomes. A: The volcano plot demonstrates the differentially expressed miRNAs between HepG2.2.15-derived exosomes and HepG2-derived exosomes. Using a threshold of a P value less than 0.05 and absolute value of log2FC exceeding one, the up-regulated miRNAs are illustrated in red, while down-regulated miRNAs are in green; B: A heat map represents alterations in the expression of the differential miRNAs between HepG2.2.15-derived and HepG2-derived exosomes; with the colour red symbolising up-regulated miRNAs and blue indicating down-regulated miRNAs; C: The Gene Ontology enrichment analysis provides an insightful look into the respective target genes of the differentially expressed miRNAs; D: Enriched Kyoto Encyclopedia of Genes and Genomes pathway statistics are shown in scatter plots, highlighting the top 20 enriched pathways for an easy comparison and further analysis. GO: Gene Ontology; KEGG: Kyoto Encyclopedia of Genes and Genomes; HBV: Hepatitis B virus; FC: Fold change.
- Citation: Gao Y, Li L, Zhang SN, Mang YY, Zhang XB, Feng SM. HepG2.2.15-derived exosomes facilitate the activation and fibrosis of hepatic stellate cells. World J Gastroenterol 2024; 30(19): 2553-2563
- URL: https://www.wjgnet.com/1007-9327/full/v30/i19/2553.htm
- DOI: https://dx.doi.org/10.3748/wjg.v30.i19.2553


