Copyright
©The Author(s) 2024.
World J Gastroenterol. May 14, 2024; 30(18): 2454-2466
Published online May 14, 2024. doi: 10.3748/wjg.v30.i18.2454
Published online May 14, 2024. doi: 10.3748/wjg.v30.i18.2454
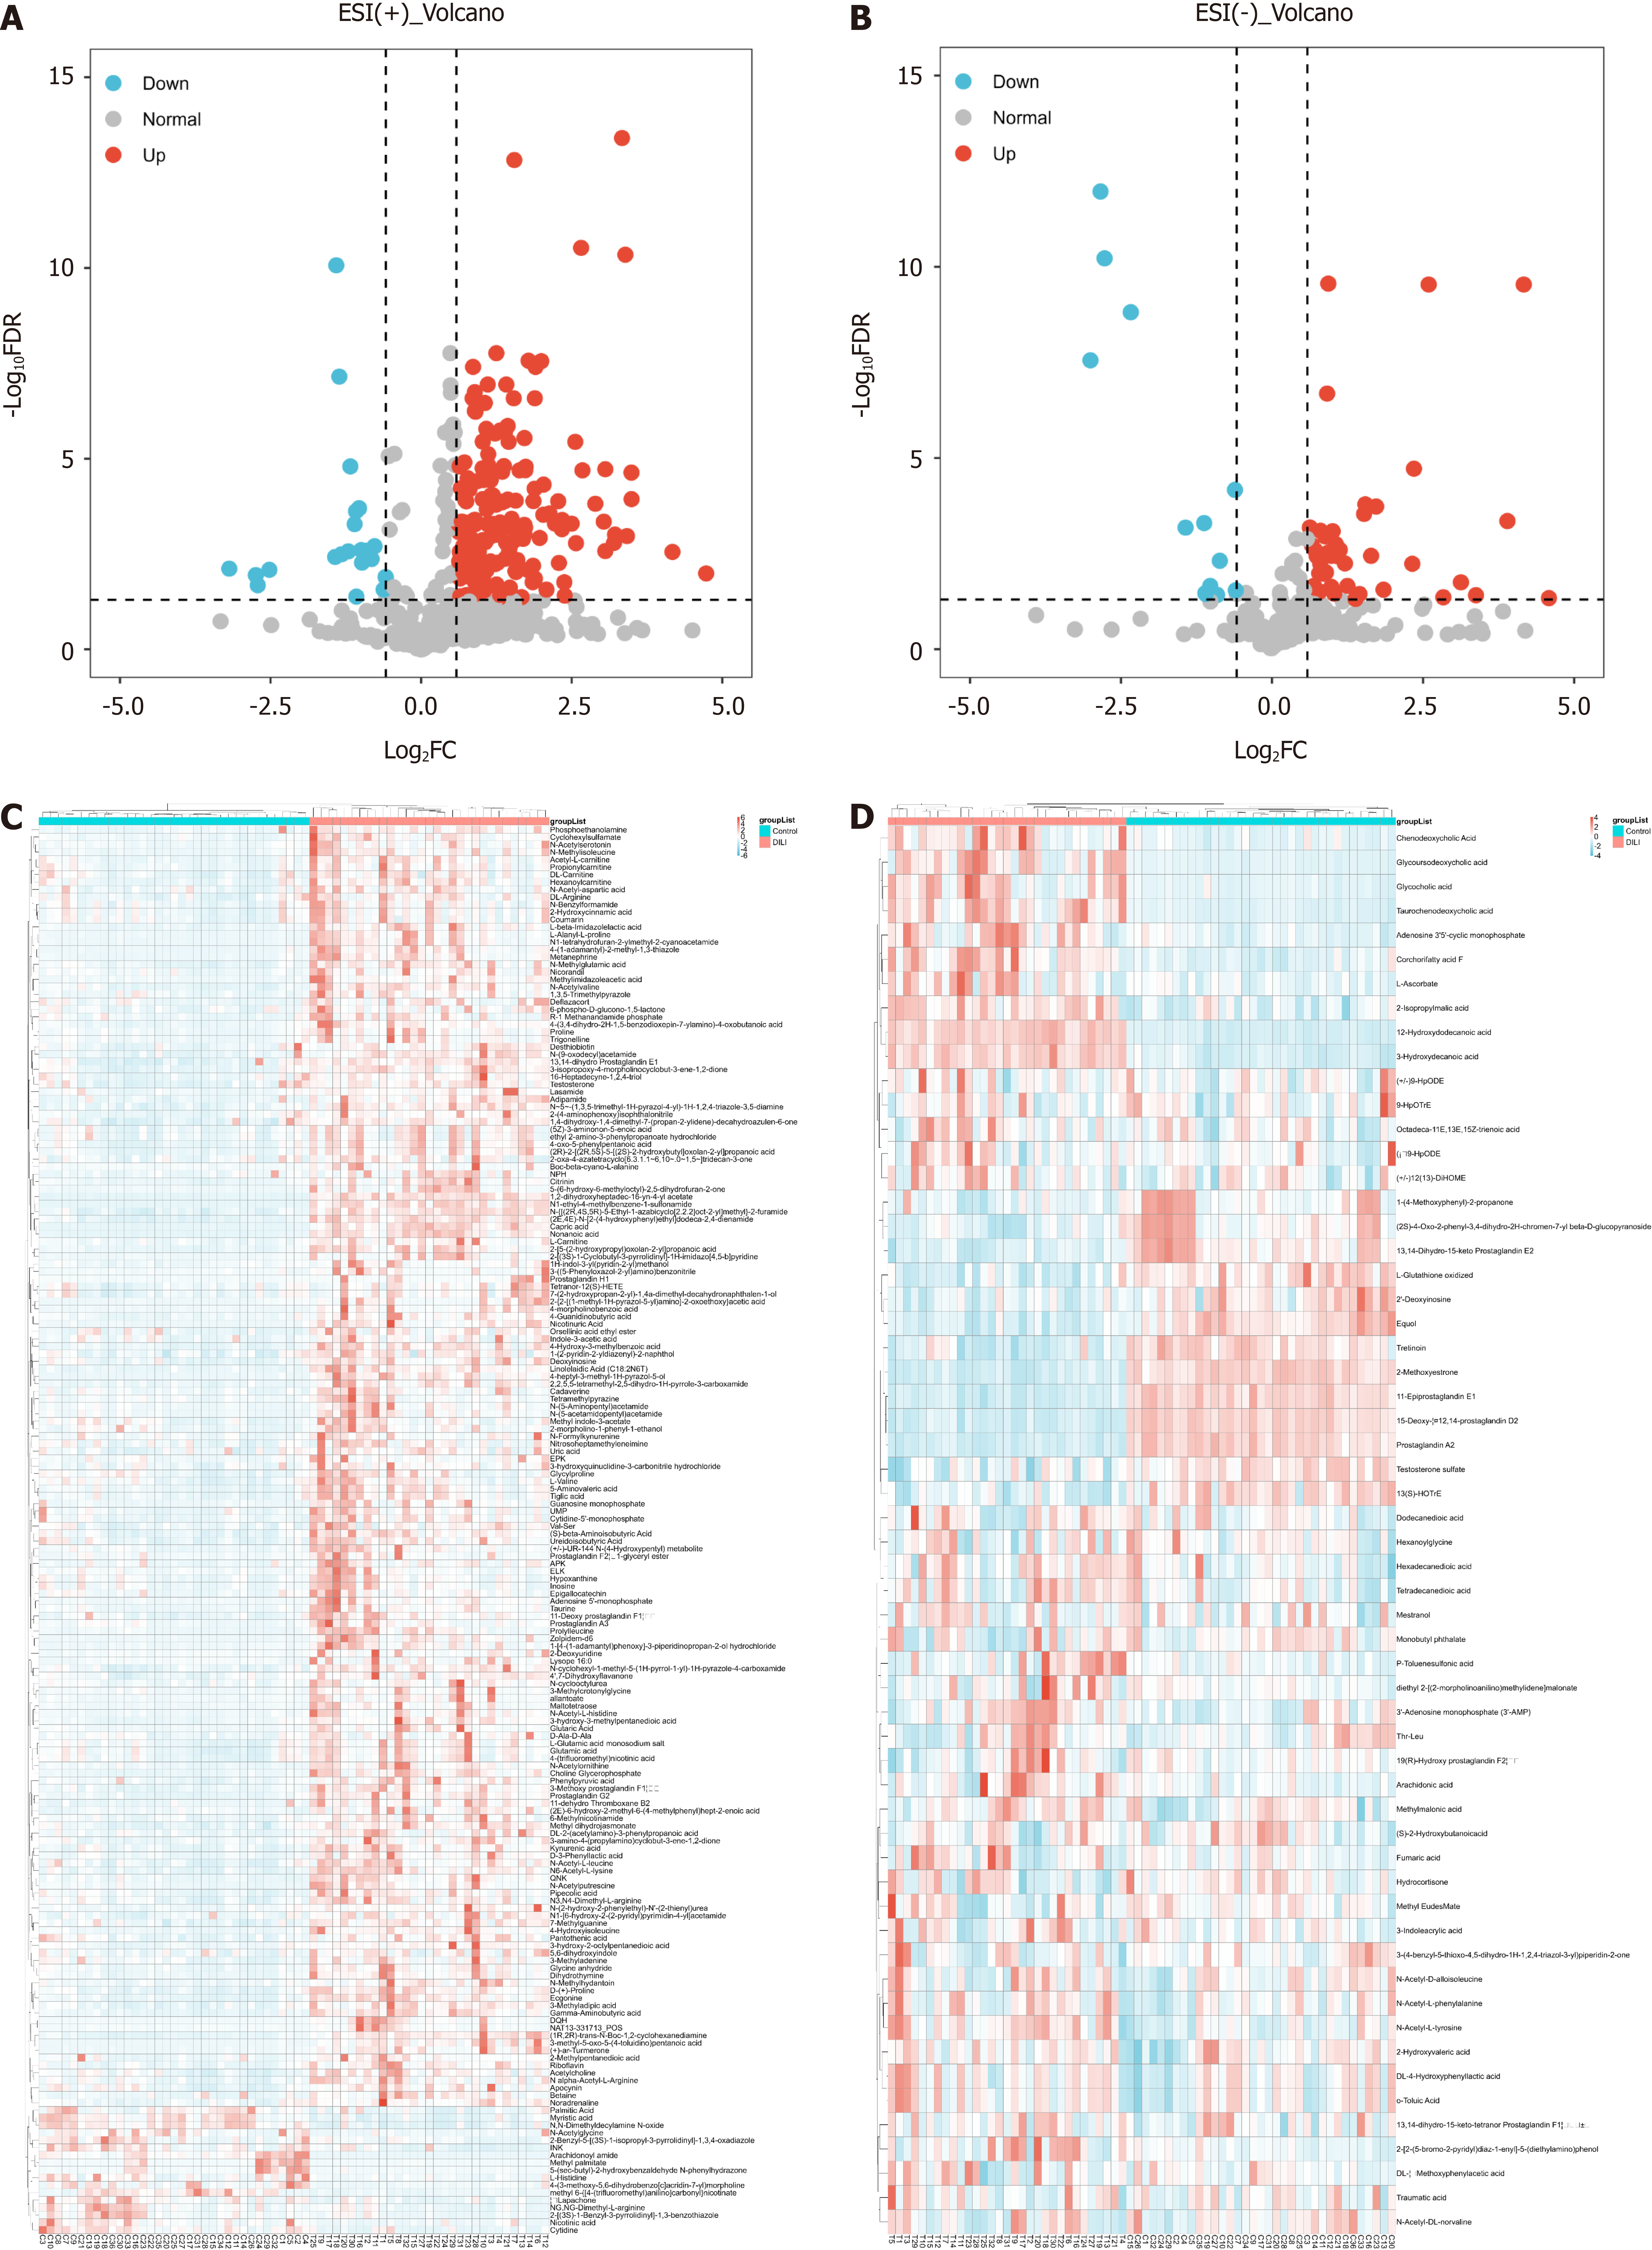
Figure 2 Differentially abundant metabolite analysis.
A: Volcanograms of differentially abundant metabolites between drug-induced liver injury (DILI) and healthy controls (HC) in positive mode; B: Volcanograms of differentially abundant metabolites between DILI and HC in negative mode; C: Heat plots of the differentially abundant metabolites between DILI and HC in positive mode; D: Heat plots of the differentially abundant metabolites between DILI and HC in negative mode.
- Citation: Yu SM, Zheng HC, Wang SC, Rong WY, Li P, Jing J, He TT, Li JH, Ding X, Wang RL. Salivary metabolites are promising noninvasive biomarkers of drug-induced liver injury. World J Gastroenterol 2024; 30(18): 2454-2466
- URL: https://www.wjgnet.com/1007-9327/full/v30/i18/2454.htm
- DOI: https://dx.doi.org/10.3748/wjg.v30.i18.2454


