Copyright
©The Author(s) 2024.
World J Gastroenterol. Apr 7, 2024; 30(13): 1911-1925
Published online Apr 7, 2024. doi: 10.3748/wjg.v30.i13.1911
Published online Apr 7, 2024. doi: 10.3748/wjg.v30.i13.1911
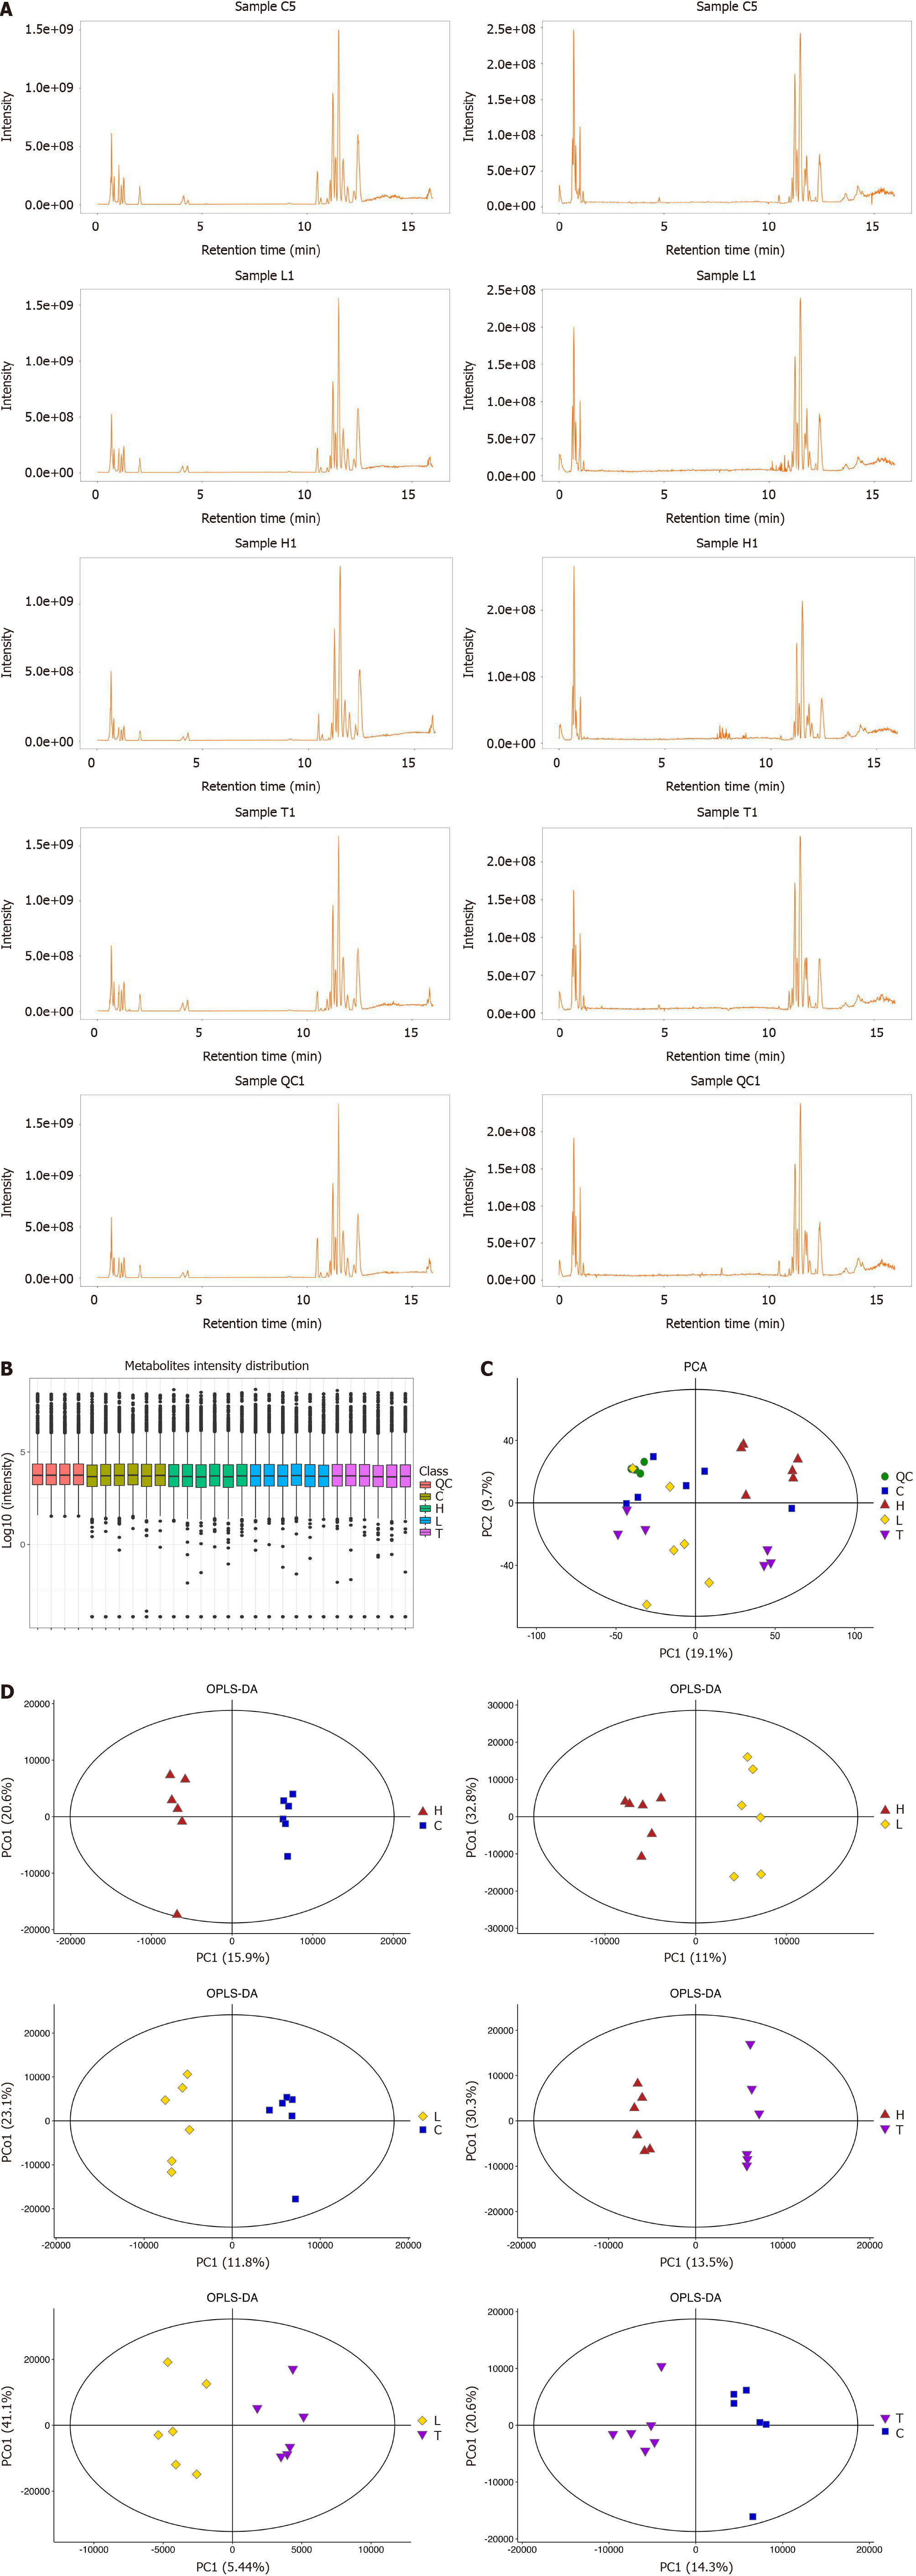
Figure 2 Quality control analysis of serum metabolomics in pAAV-HBV1.
2 replication mice treated with Liuweiwuling Tablet. A: Ion base peak diagram; B: Distribution of metabolic sensitivity; C: Principal component analysis plot; D: Orthogonal partial least squares discriminant analysis plot. LWWL: Liuweiwuling Tablet; HG: High-dose LWWL group; LG: Low-dose LWWL group; CG: Control group; TG: Tenofovir disoproxil fumarate group. OPLS-DA: Orthogonal partial least squares discriminant analysis; PCA: Principal component analysis.
- Citation: Ge FL, Yang Y, Si LL, Li YH, Cao MZ, Wang J, Bai ZF, Ren ZG, Xiao XH, Liu Y. Inhibition of hepatitis B virus via selective apoptosis modulation by Chinese patent medicine Liuweiwuling Tablet. World J Gastroenterol 2024; 30(13): 1911-1925
- URL: https://www.wjgnet.com/1007-9327/full/v30/i13/1911.htm
- DOI: https://dx.doi.org/10.3748/wjg.v30.i13.1911


