Copyright
©The Author(s) 2024.
World J Gastroenterol. Apr 7, 2024; 30(13): 1871-1886
Published online Apr 7, 2024. doi: 10.3748/wjg.v30.i13.1871
Published online Apr 7, 2024. doi: 10.3748/wjg.v30.i13.1871
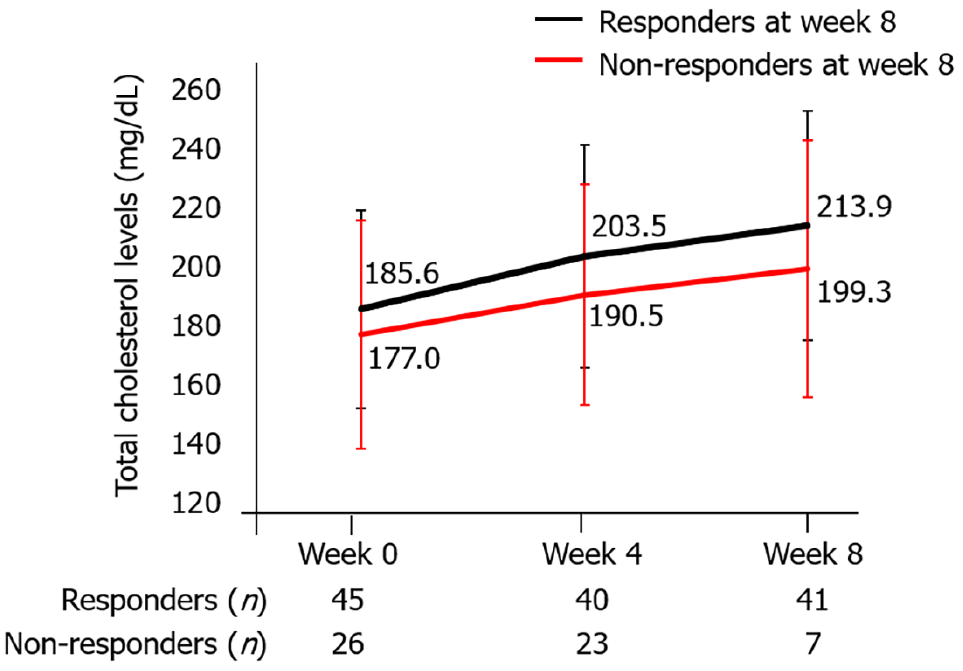
Figure 8 Total cholesterol levels from baseline to week 8 between responders and non-responders at week 8.
Data represent the mean and standard deviation.
- Citation: Kojima K, Watanabe K, Kawai M, Yagi S, Kaku K, Ikenouchi M, Sato T, Kamikozuru K, Yokoyama Y, Takagawa T, Shimizu M, Shinzaki S. Real-world efficacy and safety of tofacitinib treatment in Asian patients with ulcerative colitis. World J Gastroenterol 2024; 30(13): 1871-1886
- URL: https://www.wjgnet.com/1007-9327/full/v30/i13/1871.htm
- DOI: https://dx.doi.org/10.3748/wjg.v30.i13.1871


