Copyright
©The Author(s) 2024.
World J Gastroenterol. Mar 21, 2024; 30(11): 1621-1635
Published online Mar 21, 2024. doi: 10.3748/wjg.v30.i11.1621
Published online Mar 21, 2024. doi: 10.3748/wjg.v30.i11.1621
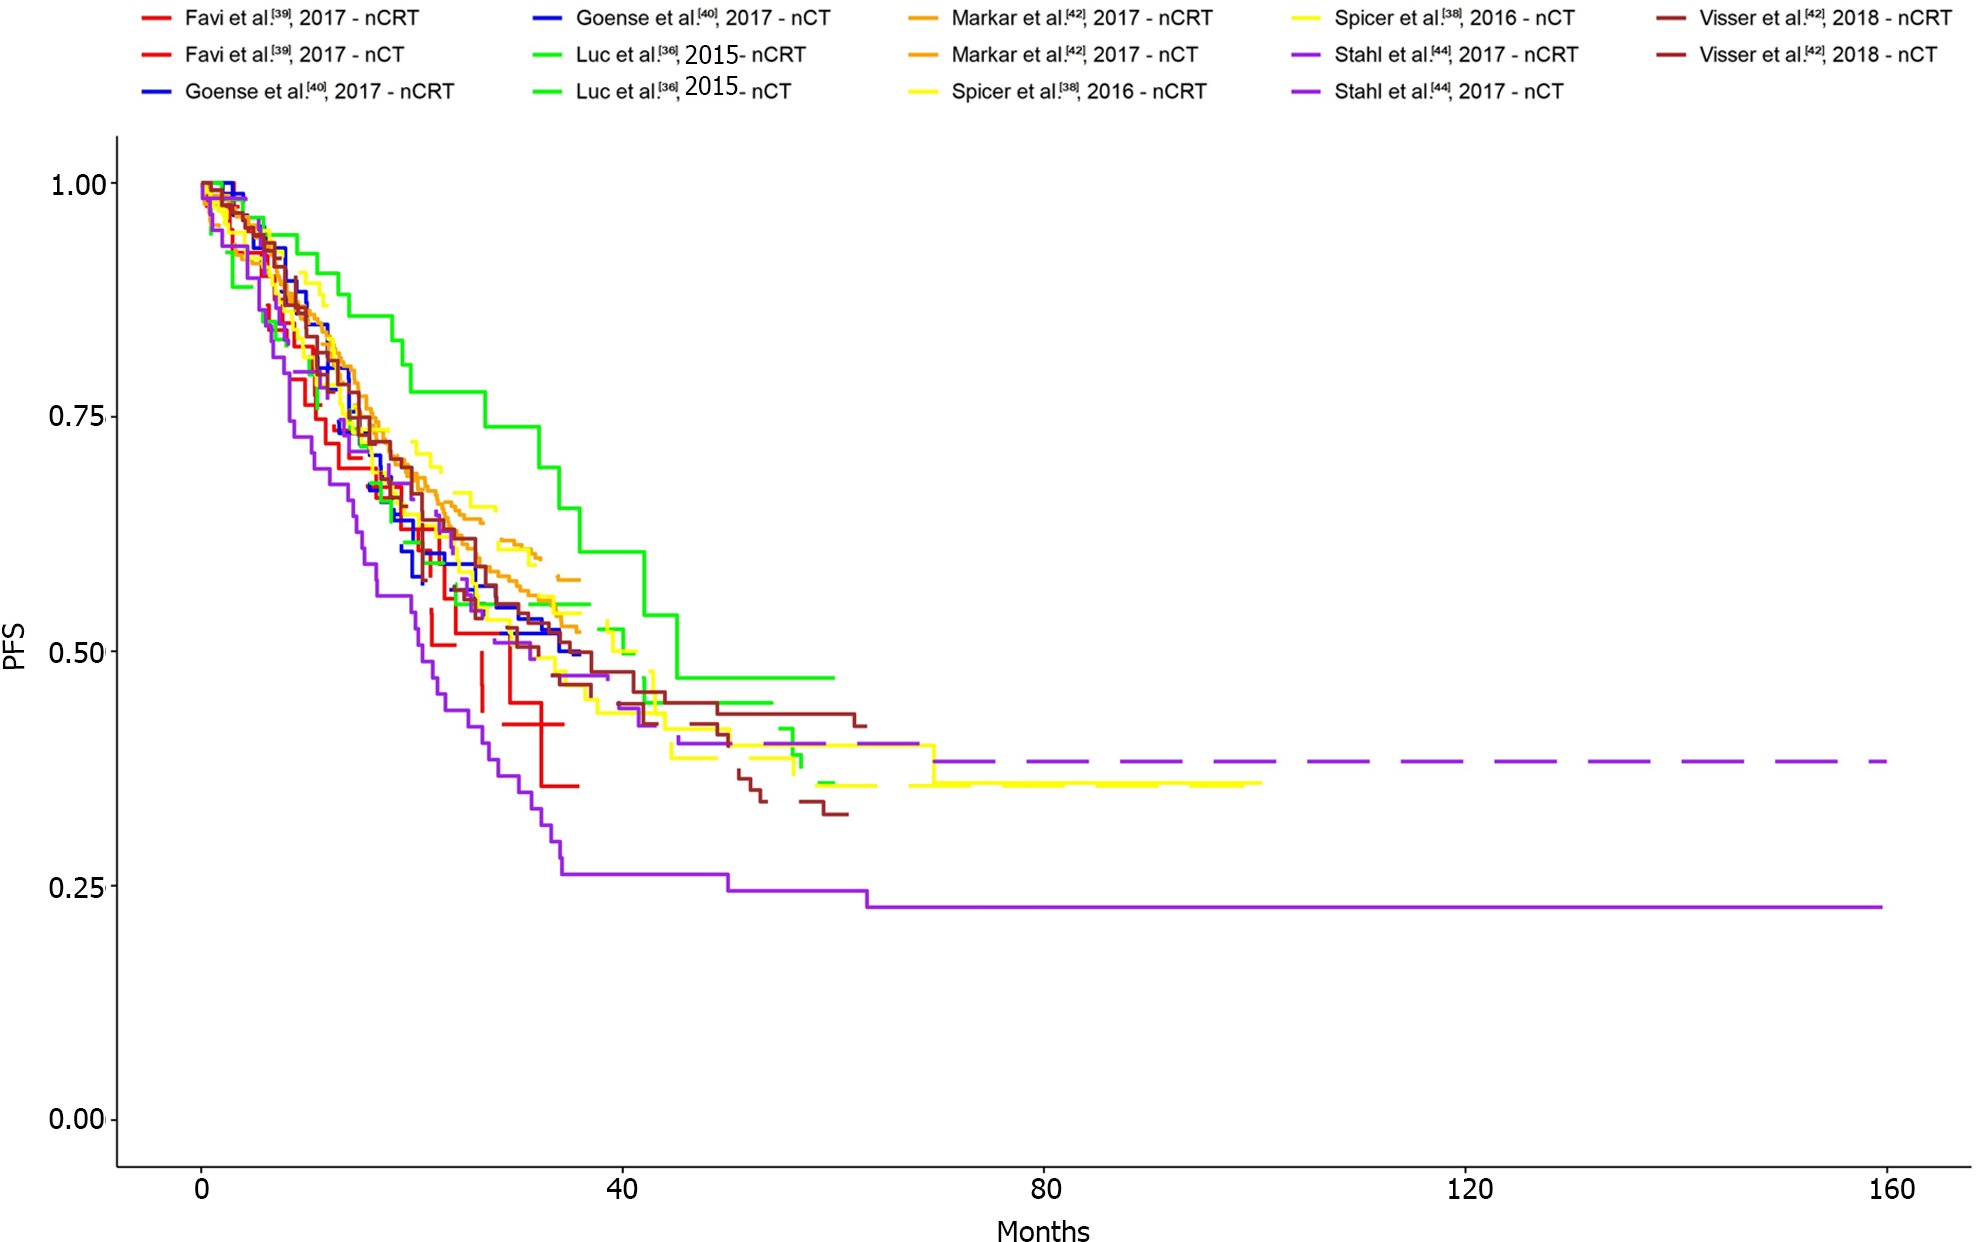
Figure 4 The Kaplan-Meier curves for the overall survival.
The x-axis shows the time in month, the y-axis shows the number of patients in percentage. nCT: Neoadjuvant chemotherapy; nCRT: Neoadjuvant chemoradiotherapy; PFS: Progression-free survival.
- Citation: Csontos A, Fazekas A, Szakó L, Farkas N, Papp C, Ferenczi S, Bellyei S, Hegyi P, Papp A. Effects of neoadjuvant chemotherapy vs chemoradiotherapy in the treatment of esophageal adenocarcinoma: A systematic review and meta-analysis. World J Gastroenterol 2024; 30(11): 1621-1635
- URL: https://www.wjgnet.com/1007-9327/full/v30/i11/1621.htm
- DOI: https://dx.doi.org/10.3748/wjg.v30.i11.1621


