Copyright
©The Author(s) 2024.
World J Gastroenterol. Mar 21, 2024; 30(11): 1609-1620
Published online Mar 21, 2024. doi: 10.3748/wjg.v30.i11.1609
Published online Mar 21, 2024. doi: 10.3748/wjg.v30.i11.1609
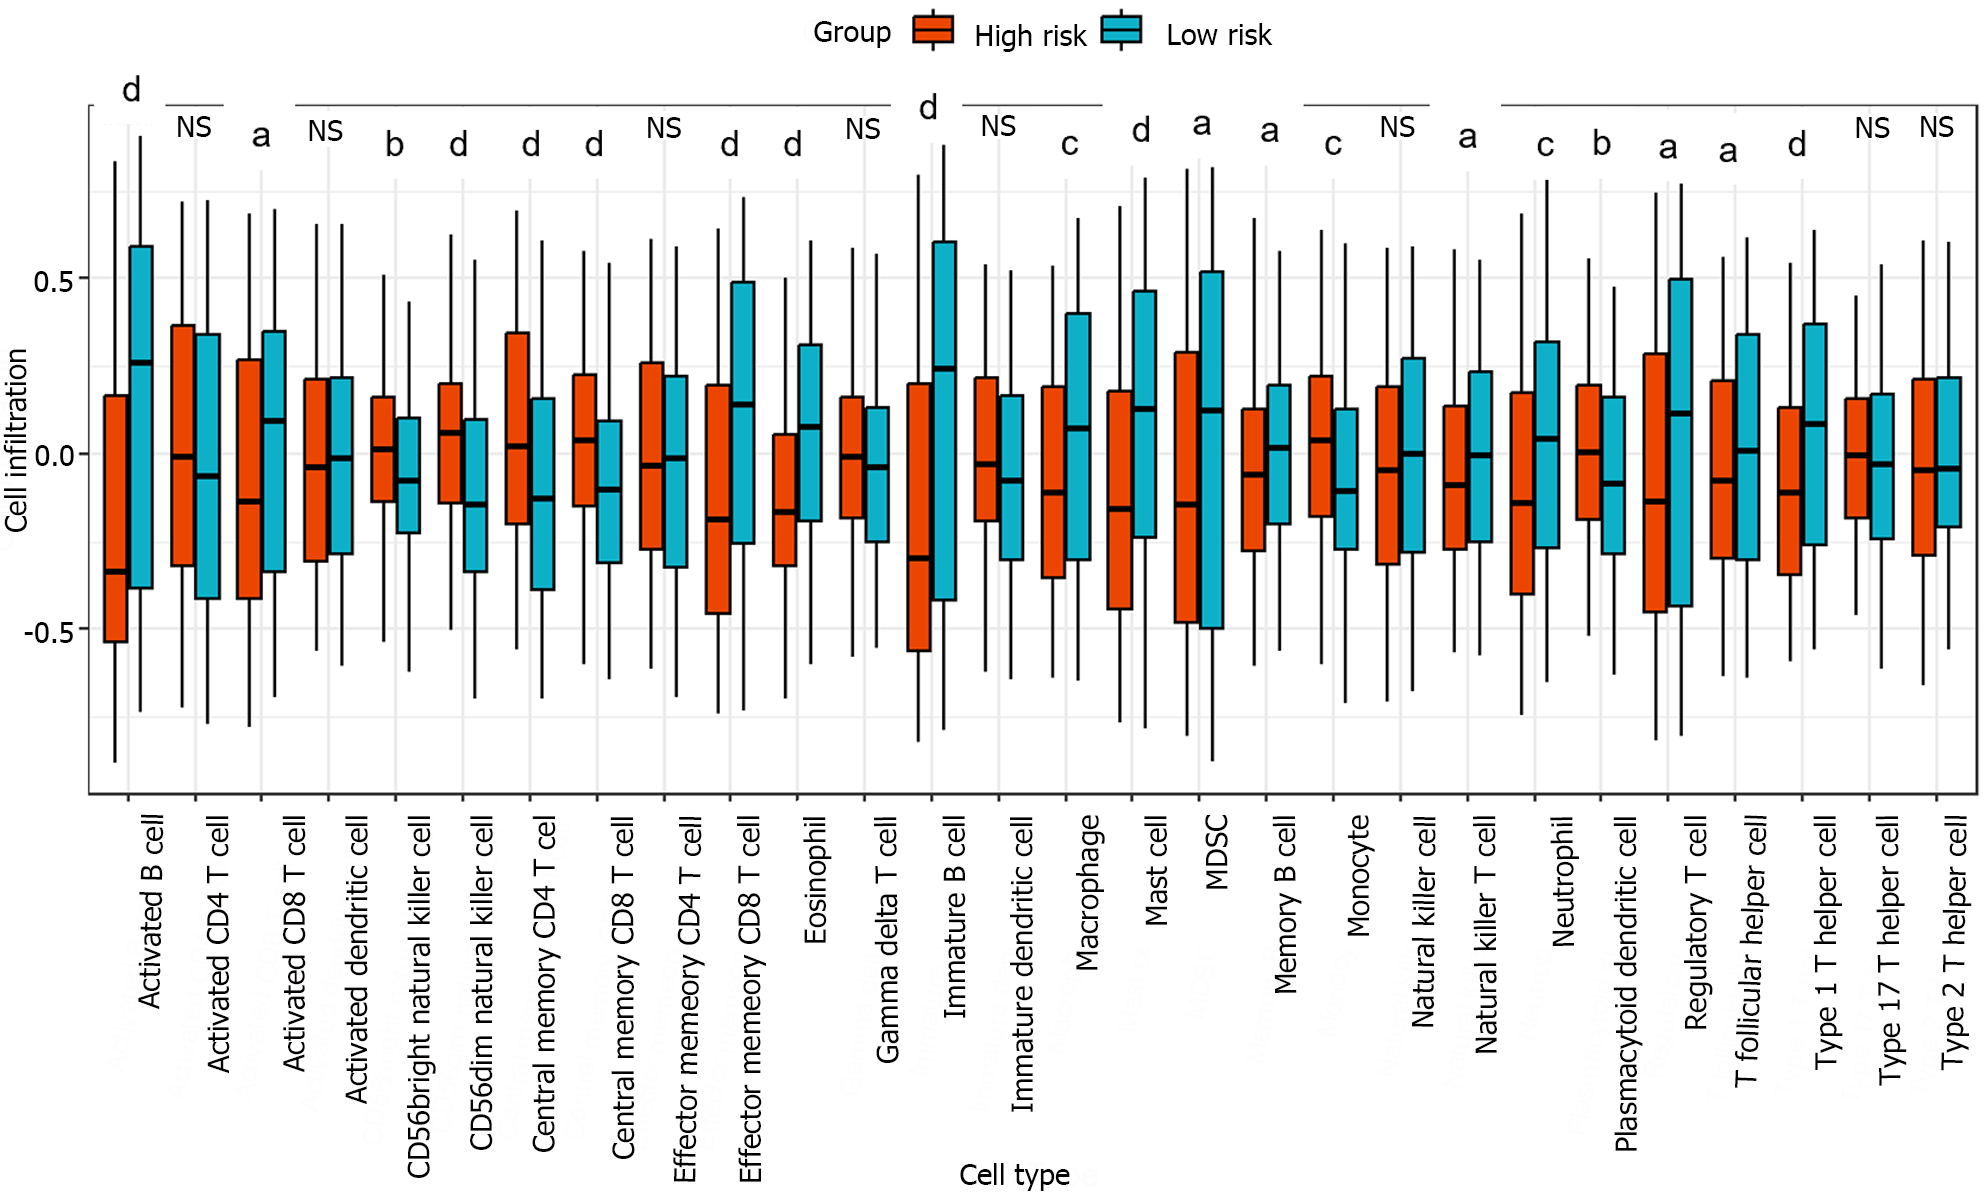
Figure 6 Box plot of the degree of immune cell infiltration in the high-risk and low-risk groups.
The infiltration degree of 28 immune cell types in the high-risk and low-risk groups was analyzed, and the significant differences between the two groups were evaluated using the Kruskal-Wallis test. aP < 0.05; bP < 0.01; cP < 0.001; dP < 0.0001.
- Citation: Li JT, Zhang HM, Wang W, Wei DQ. Identification of an immune-related gene signature for predicting prognosis and immunotherapy efficacy in liver cancer via cell-cell communication. World J Gastroenterol 2024; 30(11): 1609-1620
- URL: https://www.wjgnet.com/1007-9327/full/v30/i11/1609.htm
- DOI: https://dx.doi.org/10.3748/wjg.v30.i11.1609


