Copyright
©The Author(s) 2024.
World J Gastroenterol. Mar 21, 2024; 30(11): 1609-1620
Published online Mar 21, 2024. doi: 10.3748/wjg.v30.i11.1609
Published online Mar 21, 2024. doi: 10.3748/wjg.v30.i11.1609
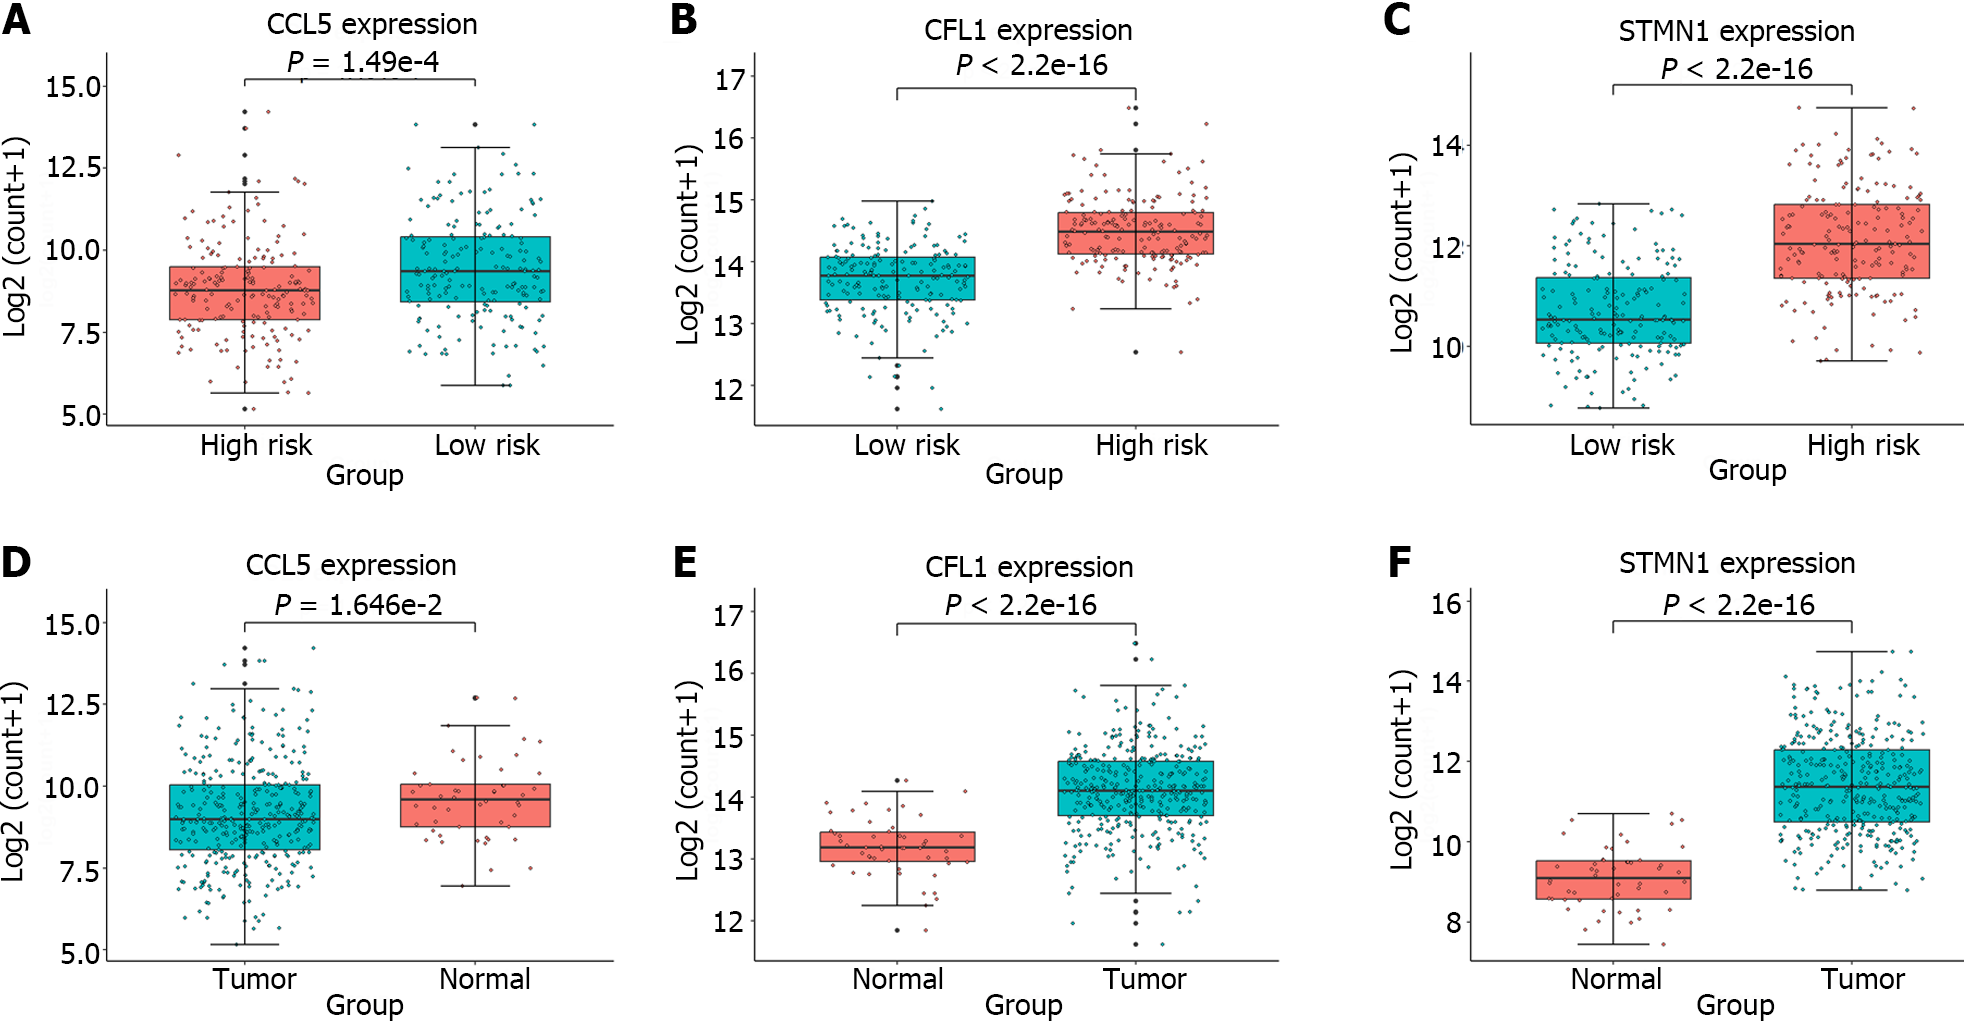
Figure 5 Box plots depicting the expression analysis of the genes employed in constructing the gene signature.
A-C: Expression analysis of C-C chemokine ligand 5 (CCL5), cofilin 1 (CFL1), and stathmin 1 (STMN1) in the high-risk and low-risk groups; D-F: Expression analysis of CCL5, CFL1, and STMN1 in the tumor and normal groups. The high-risk and normal groups are represented by red boxes, while the low-risk and tumor groups are represented by blue boxes. The significant differences between groups were evaluated through t tests. CCL5: C-C chemokine ligand 5; CFL1: Cofilin 1; STMN1: Stathmin 1.
- Citation: Li JT, Zhang HM, Wang W, Wei DQ. Identification of an immune-related gene signature for predicting prognosis and immunotherapy efficacy in liver cancer via cell-cell communication. World J Gastroenterol 2024; 30(11): 1609-1620
- URL: https://www.wjgnet.com/1007-9327/full/v30/i11/1609.htm
- DOI: https://dx.doi.org/10.3748/wjg.v30.i11.1609


