Copyright
©The Author(s) 2024.
World J Gastroenterol. Mar 21, 2024; 30(11): 1609-1620
Published online Mar 21, 2024. doi: 10.3748/wjg.v30.i11.1609
Published online Mar 21, 2024. doi: 10.3748/wjg.v30.i11.1609
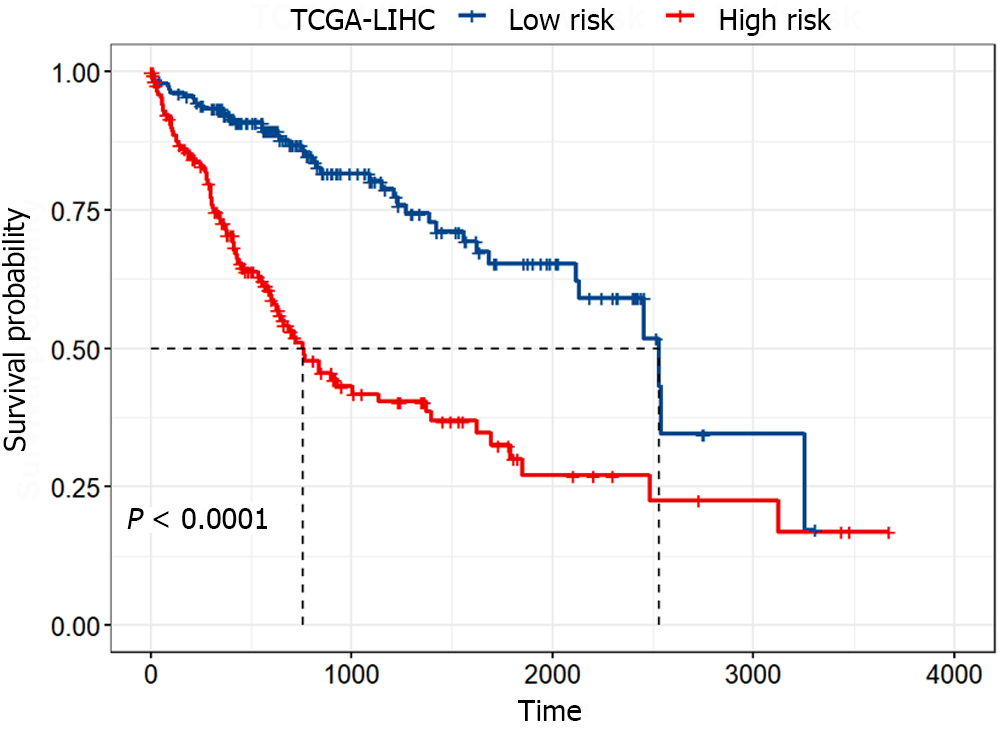
Figure 4 Kaplan-Meier survival curves of the high-risk and low-risk groups.
The red and blue curves represent the high-risk and low-risk groups, respectively, which were divided according to the median risk score. The significance of the difference between the two was evaluated through the log-rank test. TCGA-LIHC: The Cancer Genome Atlas Liver Hepatocellular Carcinoma.
- Citation: Li JT, Zhang HM, Wang W, Wei DQ. Identification of an immune-related gene signature for predicting prognosis and immunotherapy efficacy in liver cancer via cell-cell communication. World J Gastroenterol 2024; 30(11): 1609-1620
- URL: https://www.wjgnet.com/1007-9327/full/v30/i11/1609.htm
- DOI: https://dx.doi.org/10.3748/wjg.v30.i11.1609


