Copyright
©The Author(s) 2024.
World J Gastroenterol. Mar 21, 2024; 30(11): 1609-1620
Published online Mar 21, 2024. doi: 10.3748/wjg.v30.i11.1609
Published online Mar 21, 2024. doi: 10.3748/wjg.v30.i11.1609
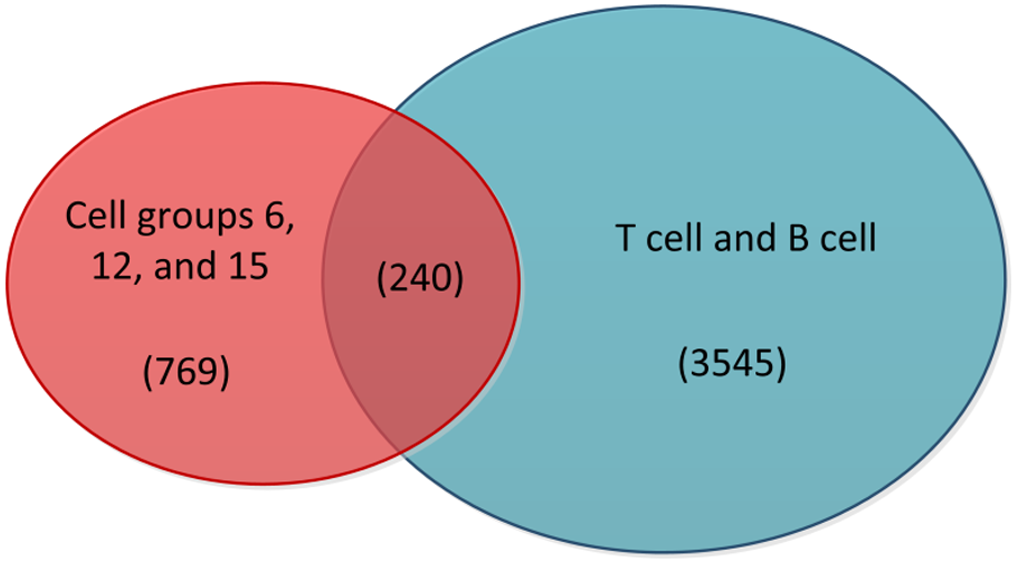
Figure 3 Venn diagram of highly active cells with T cells and B cells.
The red portion in the diagram represents cells from cell groups 6, 12, and 15, while the blue portion represents T cells and B cells. The middle section indicates the intersection between the two, and the numbers in parentheses correspond to the cell counts in these three sections.
- Citation: Li JT, Zhang HM, Wang W, Wei DQ. Identification of an immune-related gene signature for predicting prognosis and immunotherapy efficacy in liver cancer via cell-cell communication. World J Gastroenterol 2024; 30(11): 1609-1620
- URL: https://www.wjgnet.com/1007-9327/full/v30/i11/1609.htm
- DOI: https://dx.doi.org/10.3748/wjg.v30.i11.1609


