Copyright
©The Author(s) 2023.
World J Gastroenterol. Feb 21, 2023; 29(7): 1202-1218
Published online Feb 21, 2023. doi: 10.3748/wjg.v29.i7.1202
Published online Feb 21, 2023. doi: 10.3748/wjg.v29.i7.1202
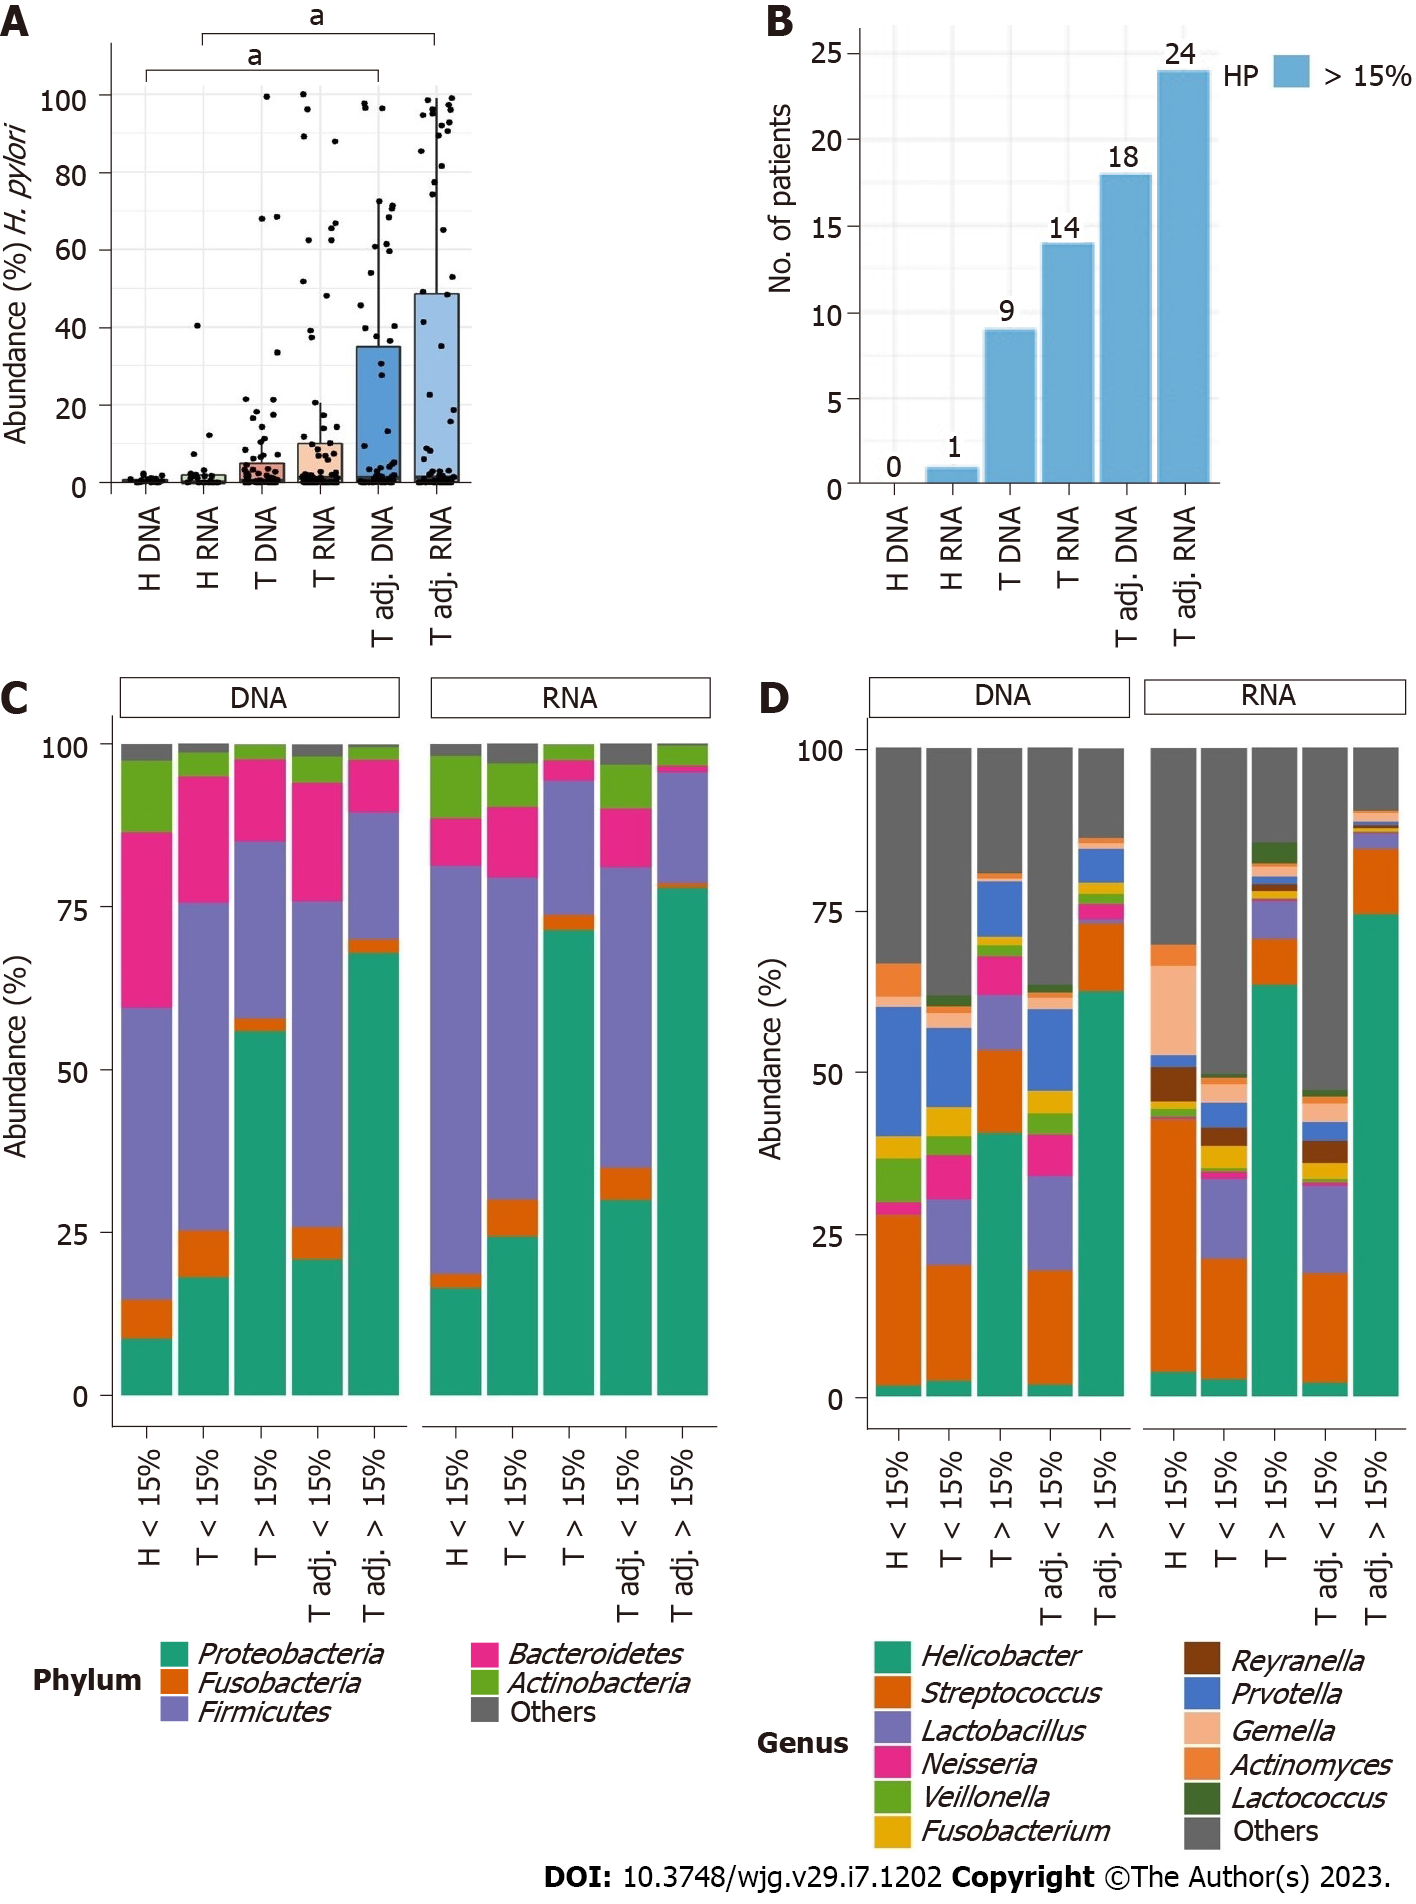
Figure 5 Comparison of gastric microbiota alterations at the DNA and RNA levels depending on high Helicobacter pylori abundance (> 15%).
A and B: Relative mean abundance of Helicobacter pylori (H. pylori) in all study groups and the number of patients with high H. pylori abundance; C and D: Comparison of the relative abundance of the top 5 microbiota at the phylum and top 11 microbiota at the genus levels. aq < 0.05.
- Citation: Nikitina D, Lehr K, Vilchez-Vargas R, Jonaitis LV, Urba M, Kupcinskas J, Skieceviciene J, Link A. Comparison of genomic and transcriptional microbiome analysis in gastric cancer patients and healthy individuals. World J Gastroenterol 2023; 29(7): 1202-1218
- URL: https://www.wjgnet.com/1007-9327/full/v29/i7/1202.htm
- DOI: https://dx.doi.org/10.3748/wjg.v29.i7.1202


