Copyright
©The Author(s) 2023.
World J Gastroenterol. Feb 21, 2023; 29(7): 1202-1218
Published online Feb 21, 2023. doi: 10.3748/wjg.v29.i7.1202
Published online Feb 21, 2023. doi: 10.3748/wjg.v29.i7.1202
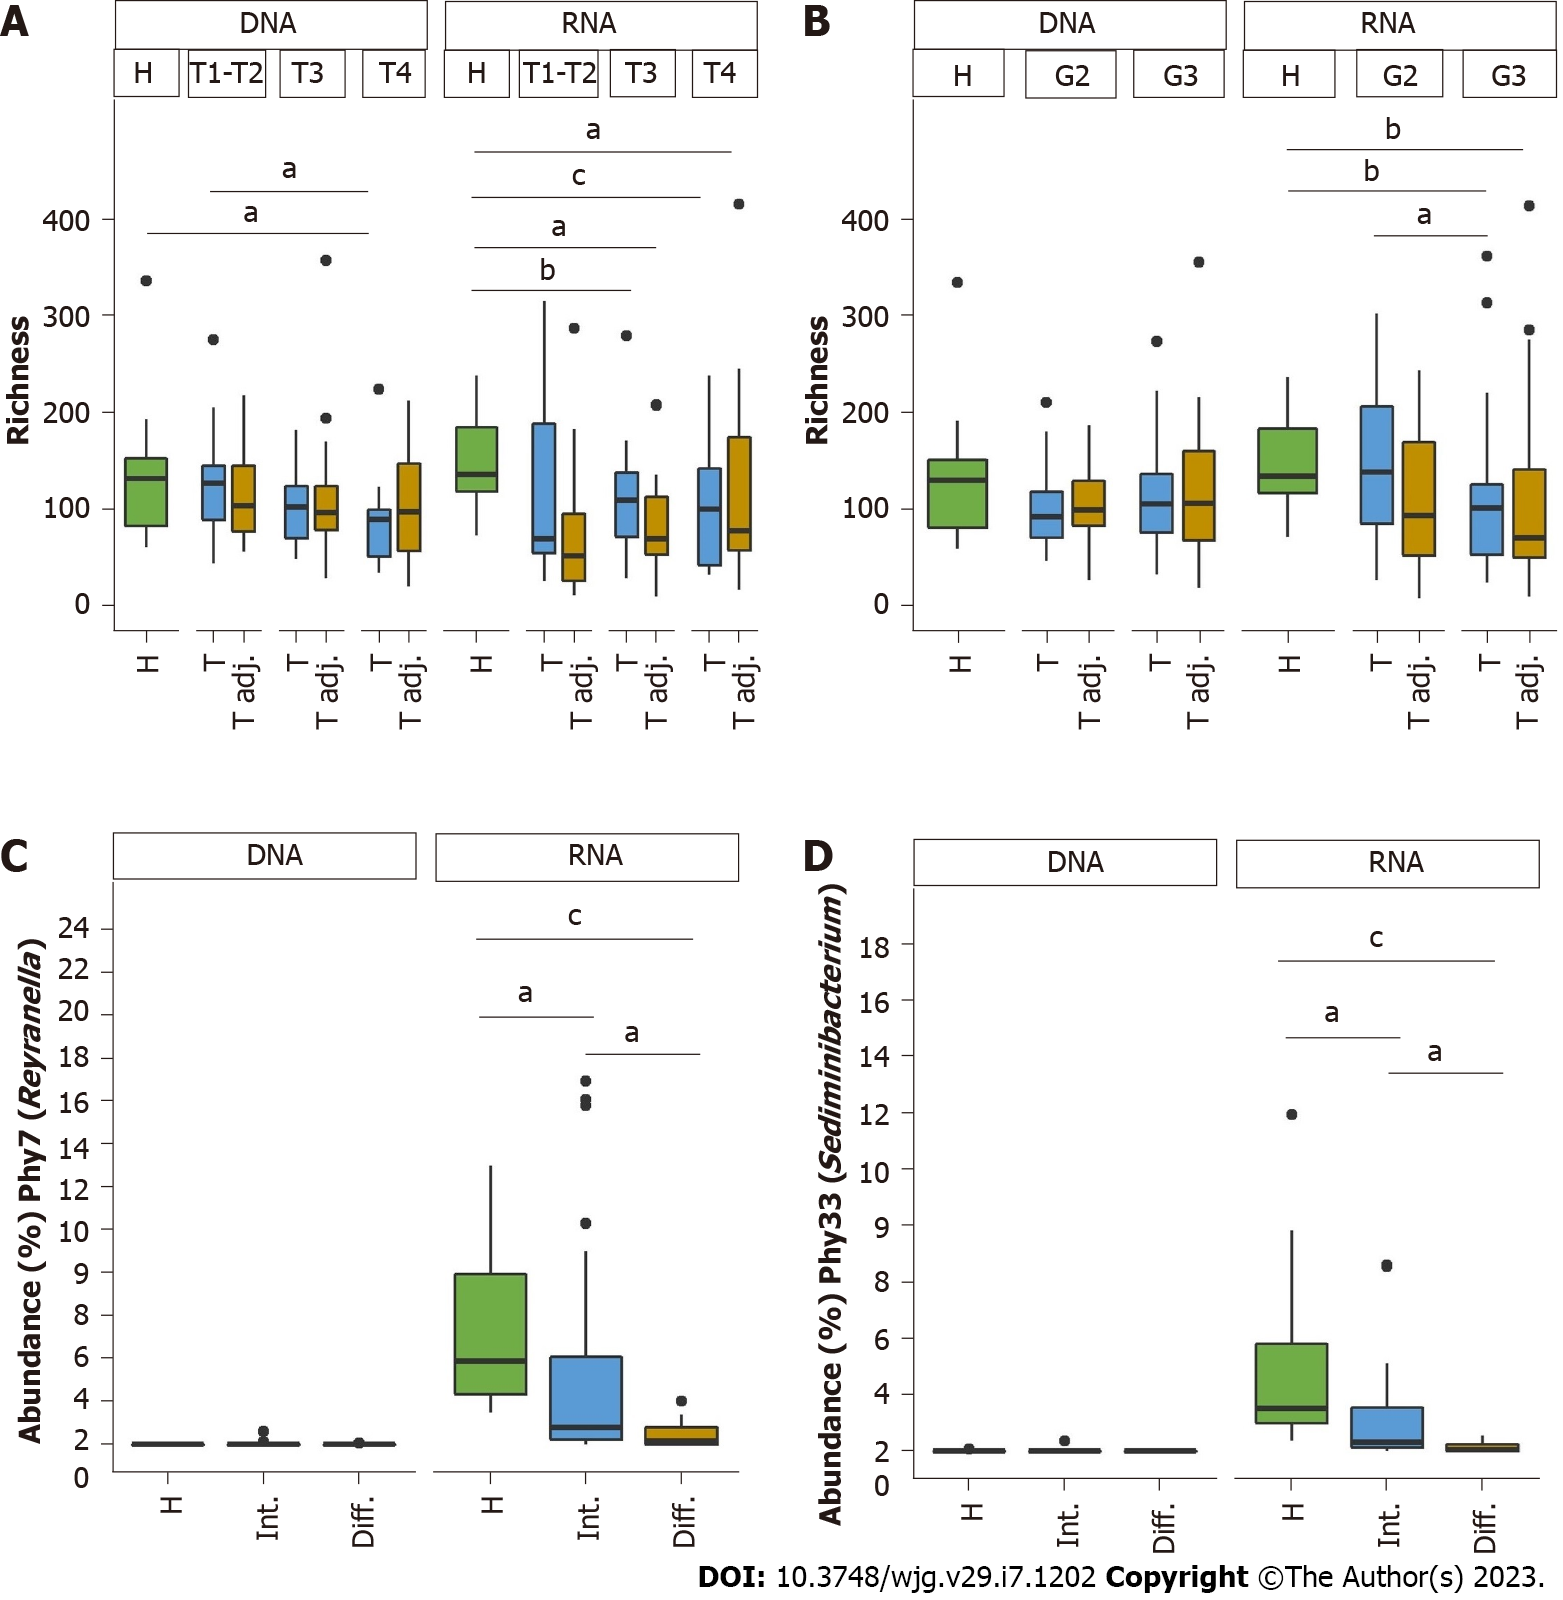
Figure 4 Comparison of bacterial abundance and richness in relation to clinical data at the DNA and RNA levels.
A: Bacterial richness according to tumor size; B: Bacterial richness according to grading; C and D: Comparison of the relative mean abundance of Phy7 (Reyranella) and Phy33 (Sediminibacterium). Statistically significant differences between study groups are indicated, aq < 0.05, bq < 0.01, cq < 0.001.
- Citation: Nikitina D, Lehr K, Vilchez-Vargas R, Jonaitis LV, Urba M, Kupcinskas J, Skieceviciene J, Link A. Comparison of genomic and transcriptional microbiome analysis in gastric cancer patients and healthy individuals. World J Gastroenterol 2023; 29(7): 1202-1218
- URL: https://www.wjgnet.com/1007-9327/full/v29/i7/1202.htm
- DOI: https://dx.doi.org/10.3748/wjg.v29.i7.1202


