Copyright
©The Author(s) 2023.
World J Gastroenterol. Feb 21, 2023; 29(7): 1202-1218
Published online Feb 21, 2023. doi: 10.3748/wjg.v29.i7.1202
Published online Feb 21, 2023. doi: 10.3748/wjg.v29.i7.1202
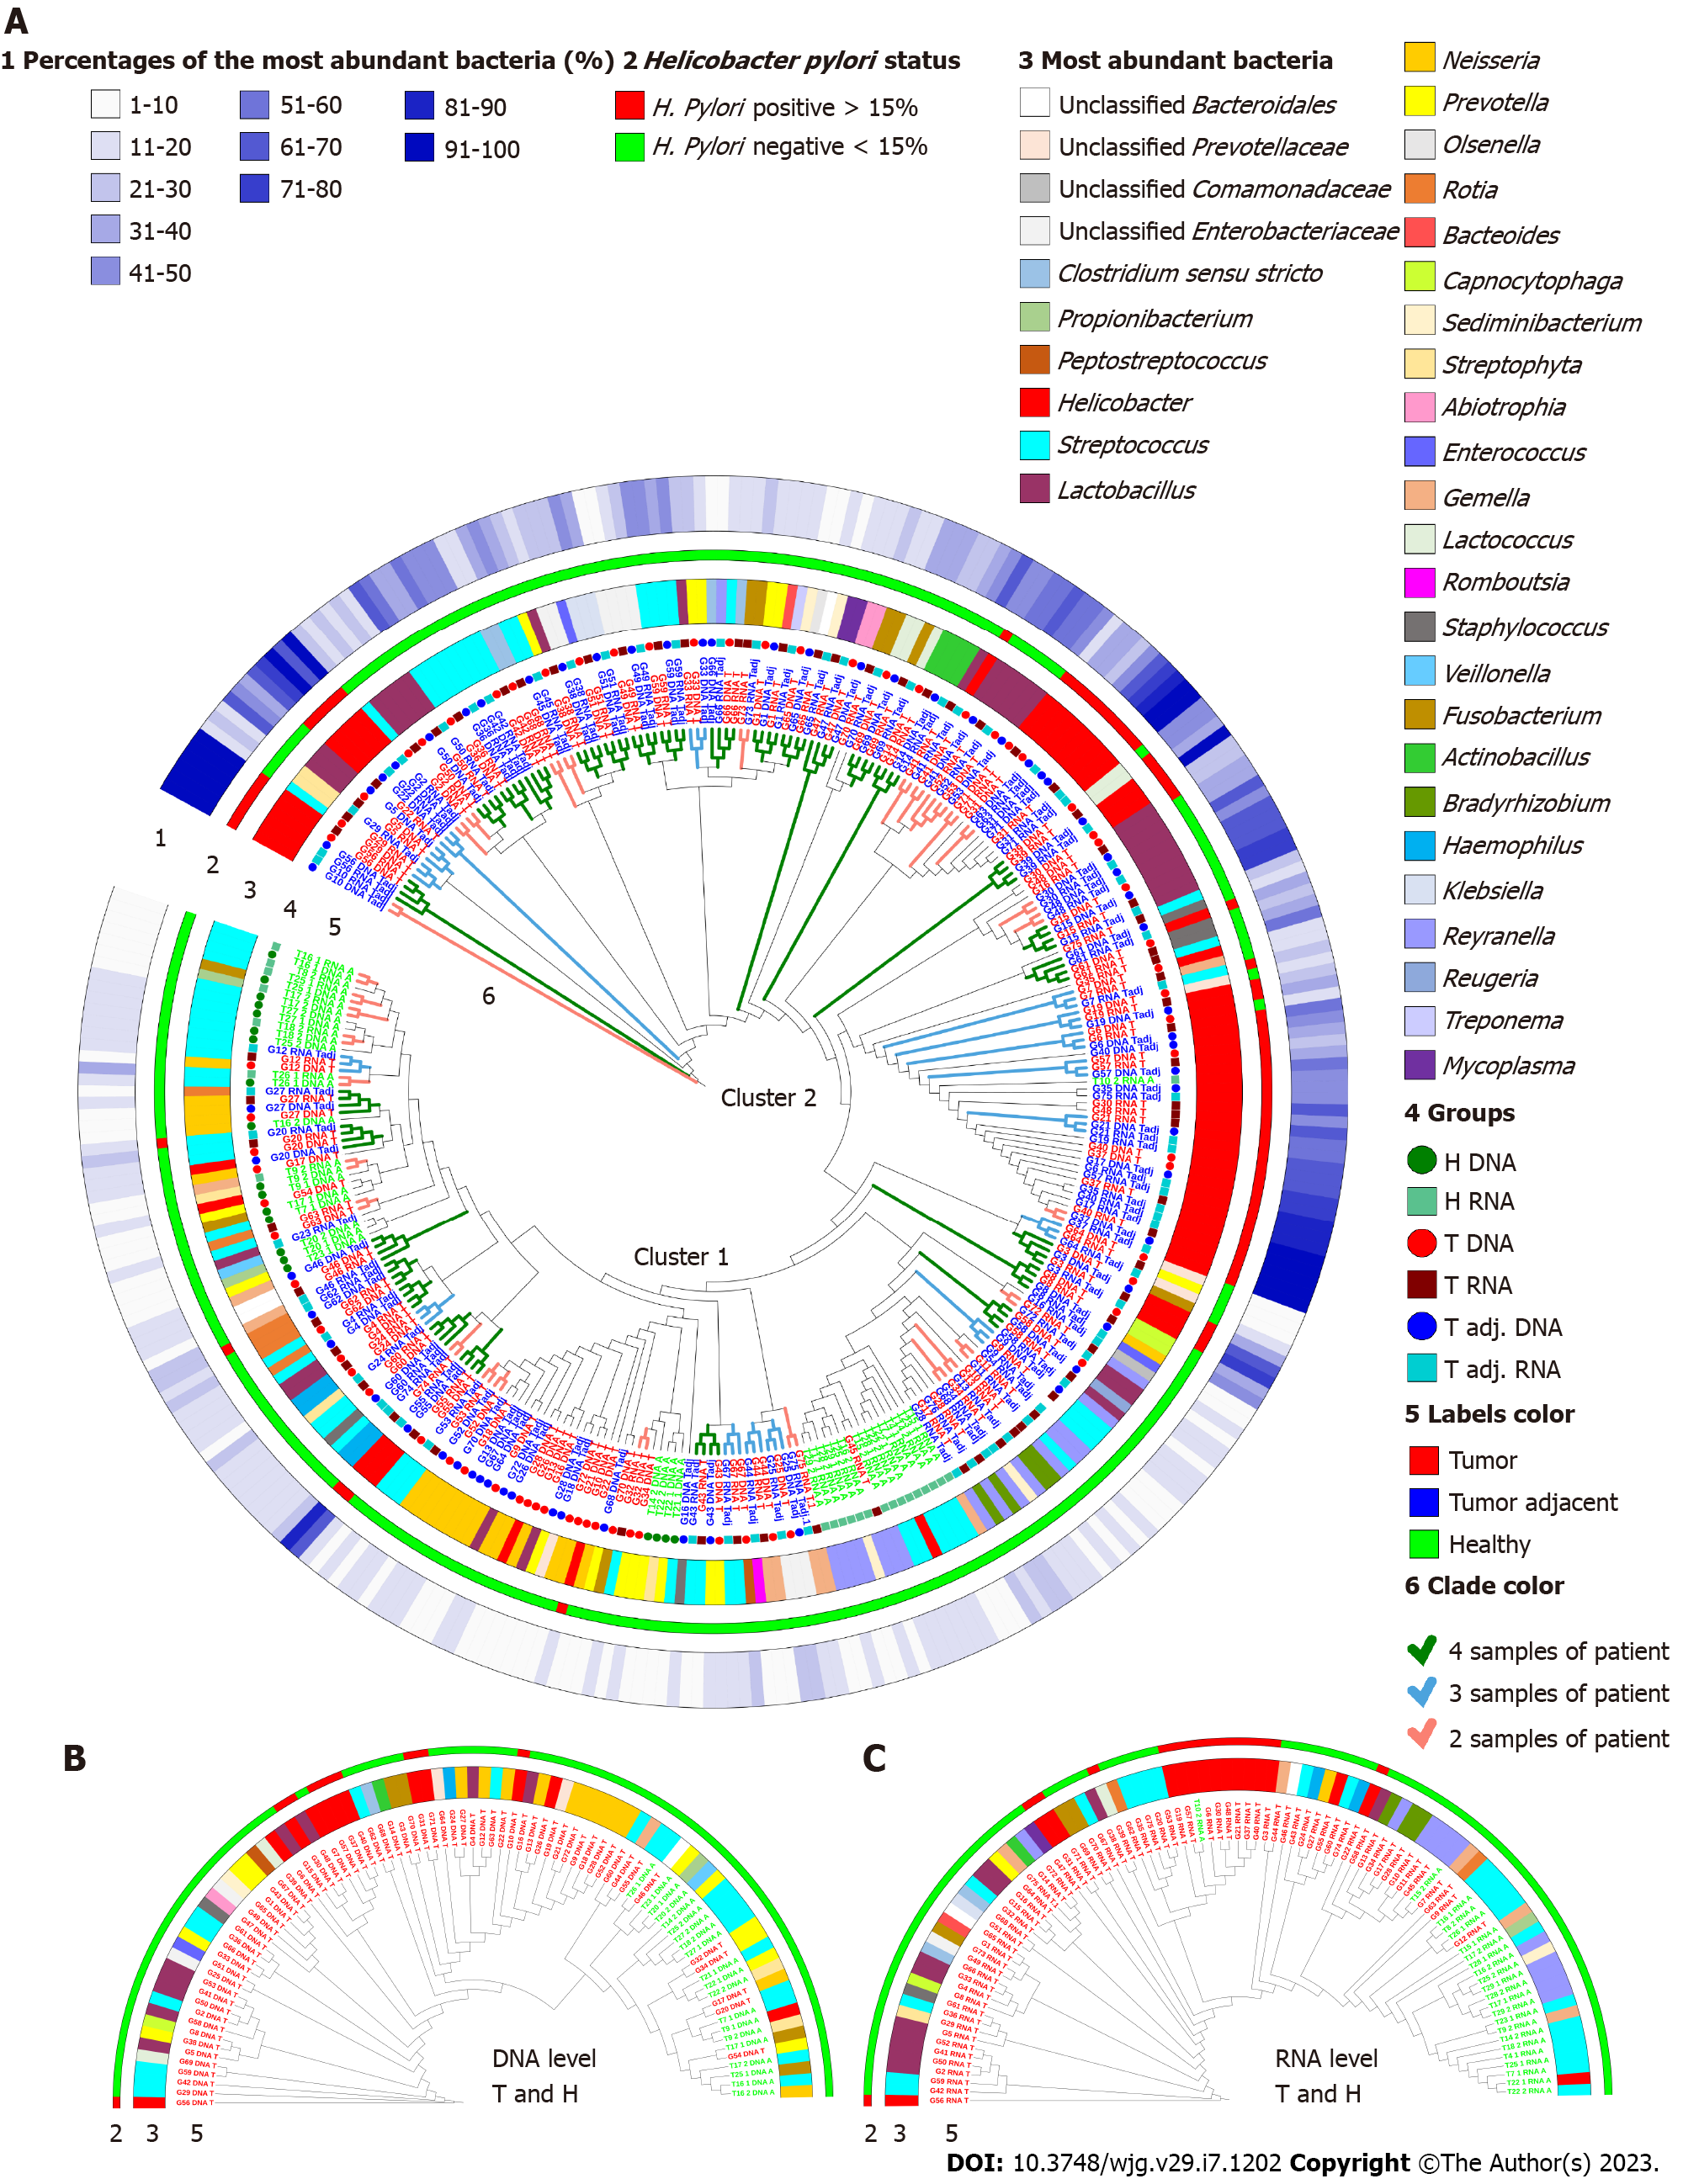
Figure 2 Group-average agglomerative hierarchical clustering at the phylotype level based on global bacterial profiles.
A: Clustering of 139 gastric cancer (GC) tumor, 134 tumors adjacent and 43 control group samples according to individual and general bacterial profiles; B and C: Clustering of GC tumor tissues and the control group at the DNA and RNA levels. The first circle (1) depicts the part of the most abundant bacteria; the second circle (2) represents the status of Helicobacter pylori; the third circle (3) shows the most abundant bacteria at the genus level; fourth and fifth circles (4 and 5) display the samples belonging to a certain study group; clade colors (6) represent the abundance of each patient sample clustered together. H. pylori: Helicobacter pylori.
- Citation: Nikitina D, Lehr K, Vilchez-Vargas R, Jonaitis LV, Urba M, Kupcinskas J, Skieceviciene J, Link A. Comparison of genomic and transcriptional microbiome analysis in gastric cancer patients and healthy individuals. World J Gastroenterol 2023; 29(7): 1202-1218
- URL: https://www.wjgnet.com/1007-9327/full/v29/i7/1202.htm
- DOI: https://dx.doi.org/10.3748/wjg.v29.i7.1202


