Copyright
©The Author(s) 2023.
World J Gastroenterol. Dec 28, 2023; 29(48): 6222-6234
Published online Dec 28, 2023. doi: 10.3748/wjg.v29.i48.6222
Published online Dec 28, 2023. doi: 10.3748/wjg.v29.i48.6222
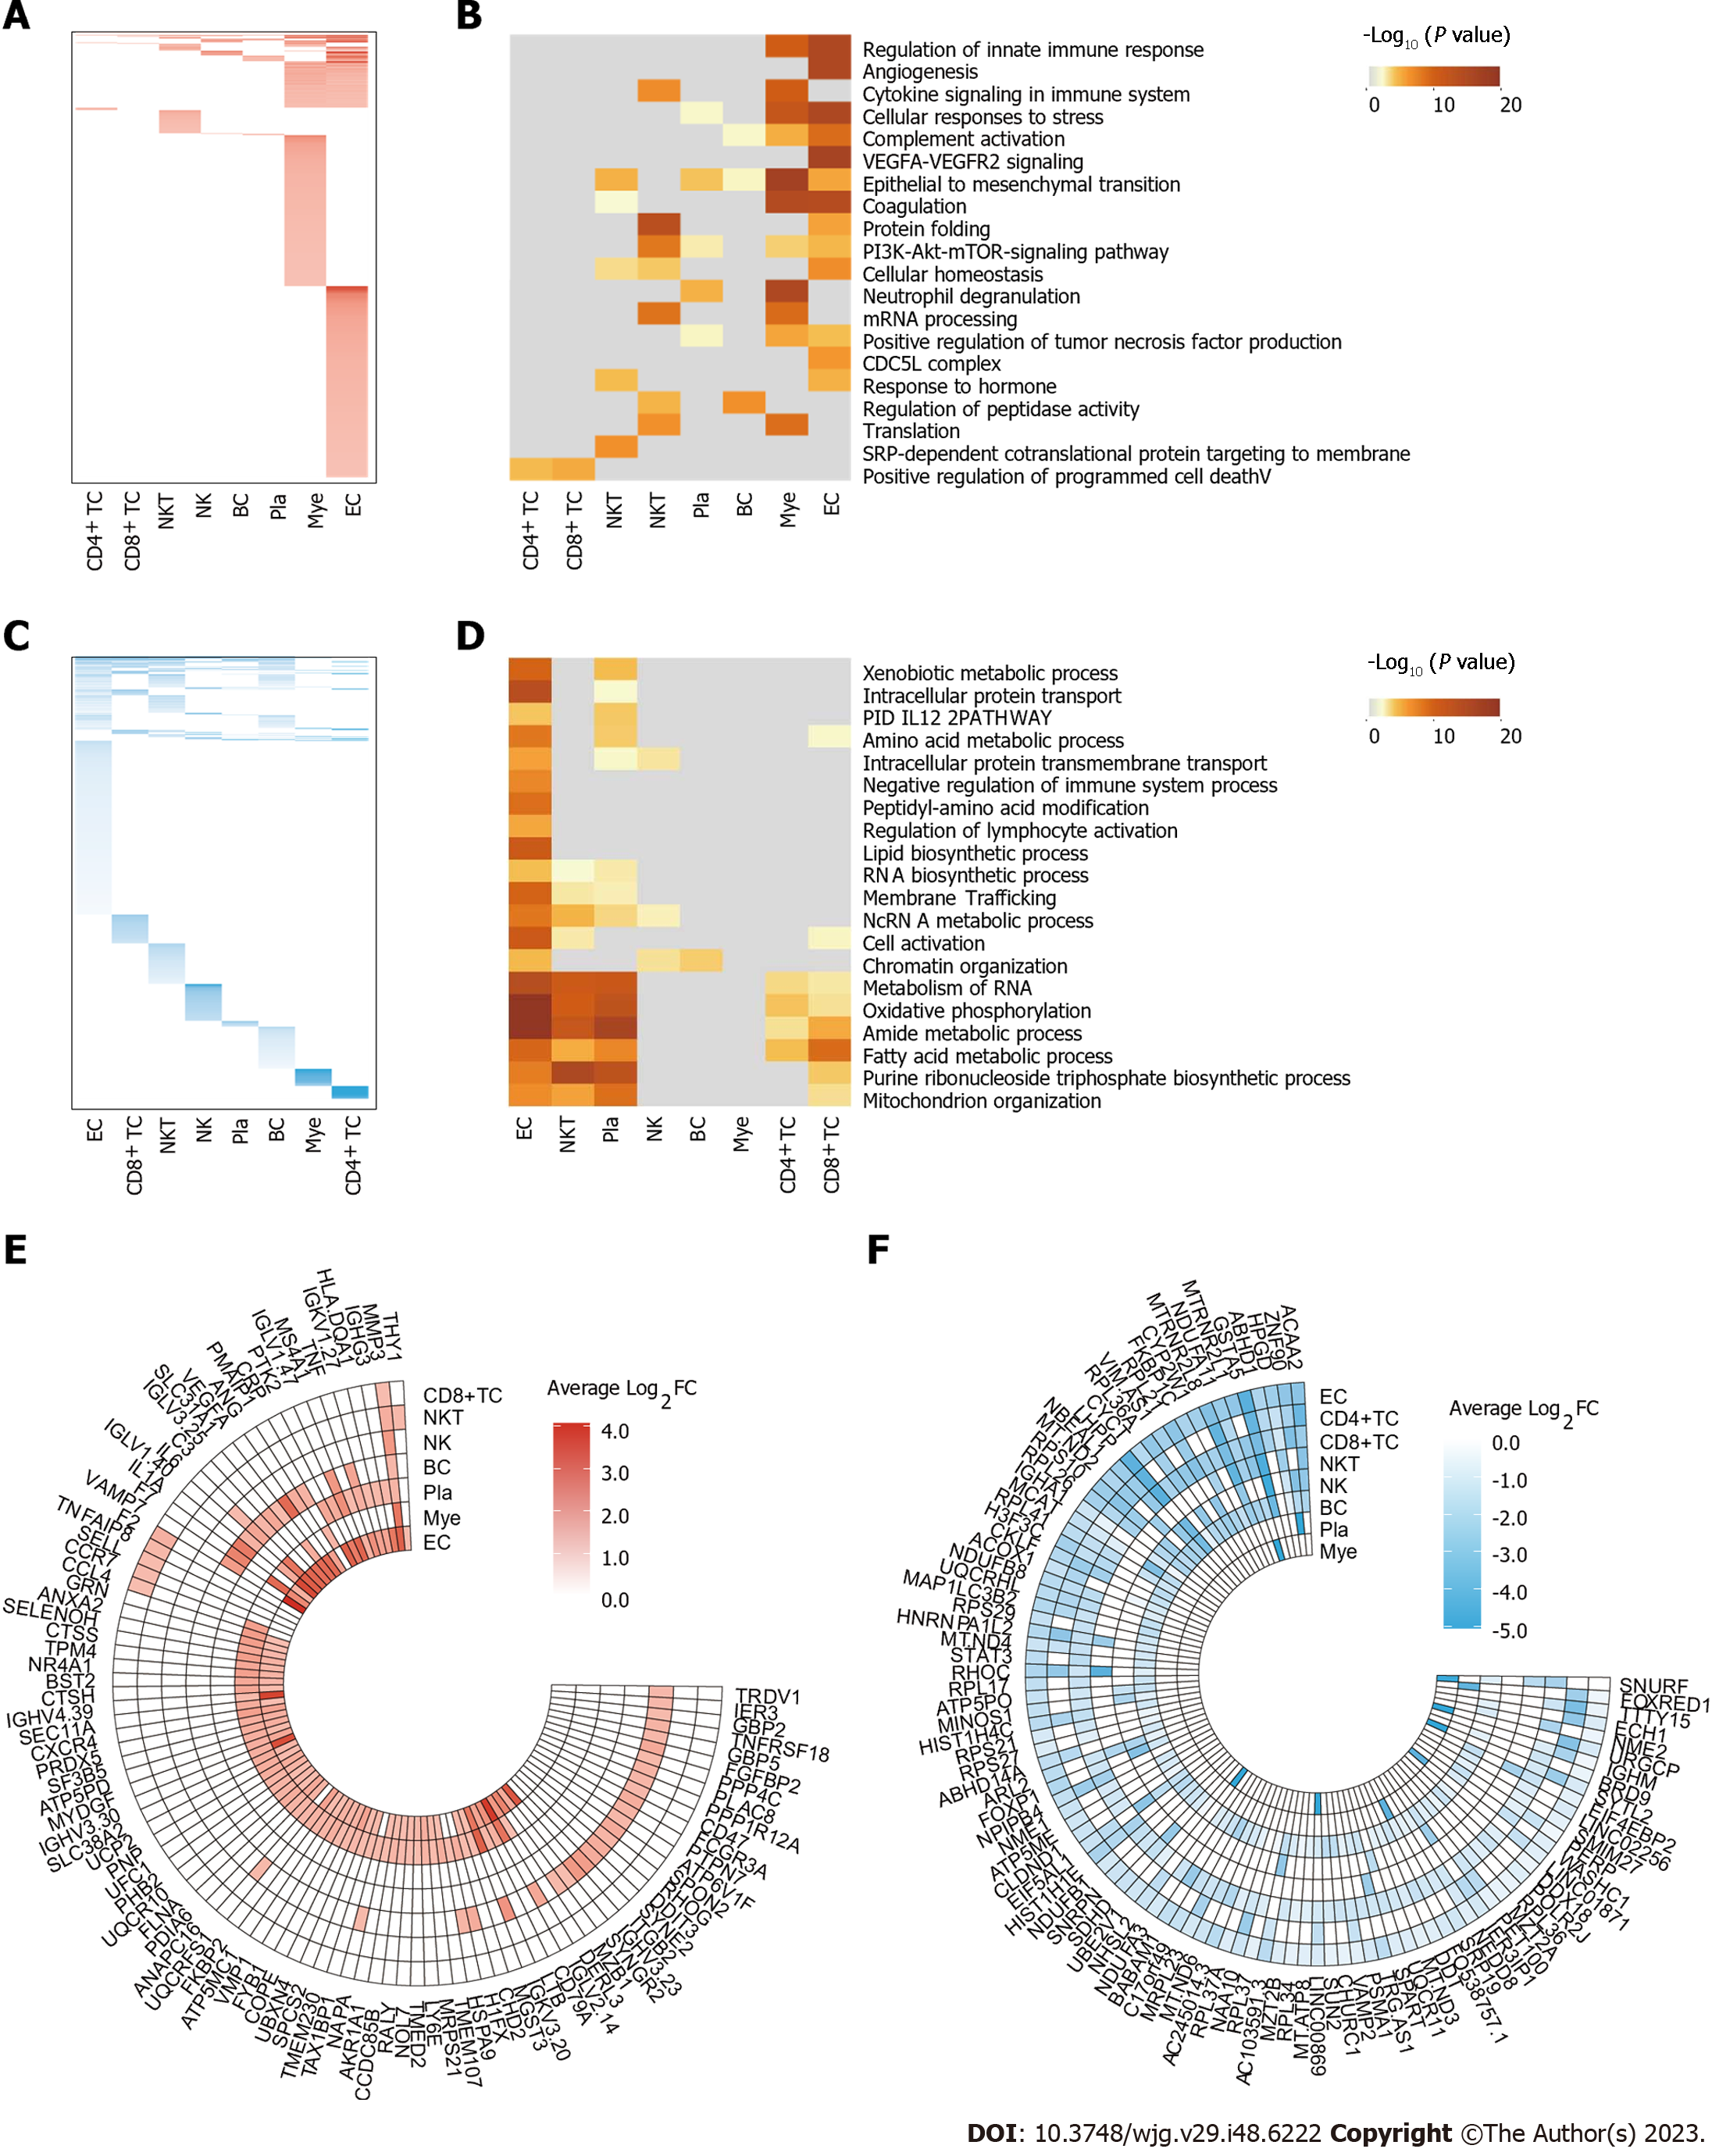
Figure 2 Alterations in transcriptional profiles across different cell types during ulcerative colitis.
A: Heatmap showing the distribution of upregulated differential expression genes (DEGs) (adjusted P value ≤ 0.05, Log2FC ≥ 0.25) for each cell type between healthy and ulcerative colitis groups (diseased/healthy); B: Heatmap showing the gene function annotations of upregulated DEGs; C: Heatmap showing the distribution of downregulated DEGs (adjusted P value ≤ 0.05, Log2FC ≤ 0.25) for each cell type between healthy and ulcerative colitis groups (diseased/healthy); D: Heatmap showing the gene function annotations of downregulated DEGs; E: Ring heatmap showing the top 100 upregulated DEGs during ulcerative colitis; F: Ring heatmap showing the top 100 downregulated DEGs during ulcerative colitis.
- Citation: Wang YF, He RY, Xu C, Li XL, Cao YF. Single-cell analysis identifies phospholysine phosphohistidine inorganic pyrophosphate phosphatase as a target in ulcerative colitis. World J Gastroenterol 2023; 29(48): 6222-6234
- URL: https://www.wjgnet.com/1007-9327/full/v29/i48/6222.htm
- DOI: https://dx.doi.org/10.3748/wjg.v29.i48.6222


