Copyright
©The Author(s) 2023.
World J Gastroenterol. Dec 28, 2023; 29(48): 6222-6234
Published online Dec 28, 2023. doi: 10.3748/wjg.v29.i48.6222
Published online Dec 28, 2023. doi: 10.3748/wjg.v29.i48.6222
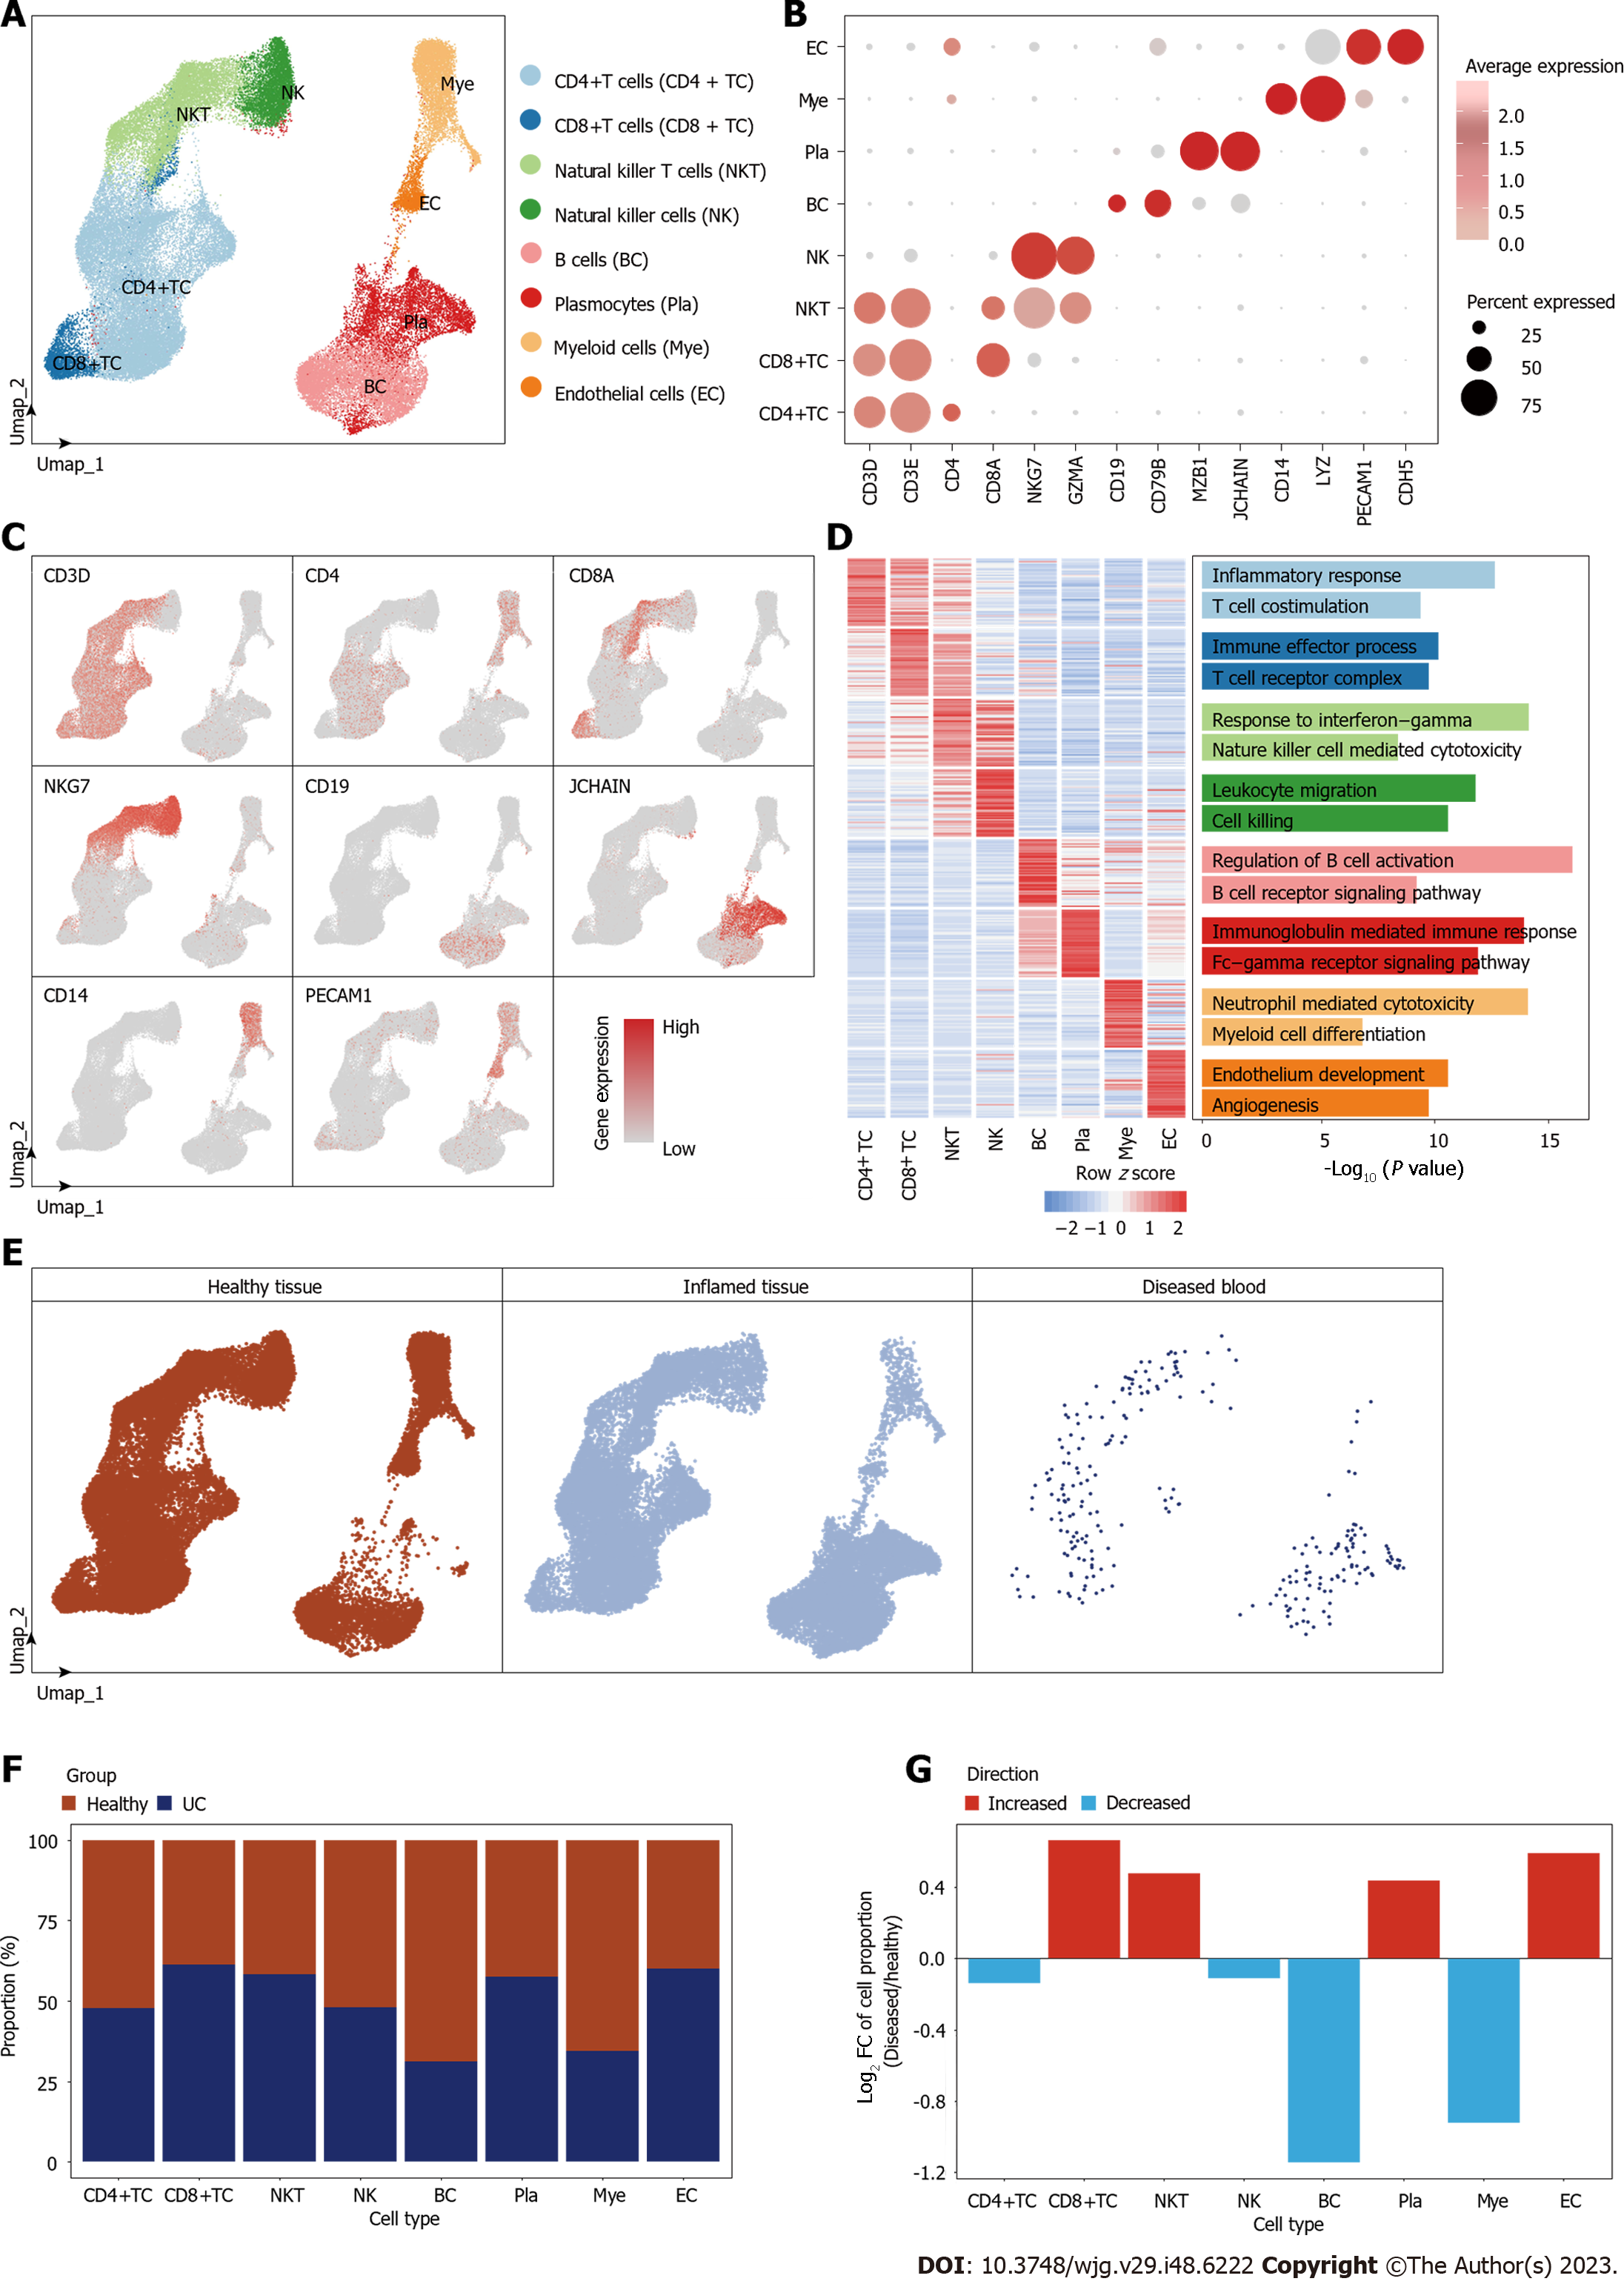
Figure 1 Cell type identification and cell proportion diversity during ulcerative colitis.
A: Umap plot showing different cell types distribution in human clonal tissues; B: Dot plot showing the gene expression levels of the classic marker genes of each cell type; C: Umap plots showing the expression profiles of indicated cell-type-specific marker genes. The color key from gray to red indicates low to high gene expression levels; D: Heatmap showing the gene expression levels of the top 50 cell-type-specific marker genes for each cell type, with corresponding functional annotations on the right. The color key from blue to red represents low to high gene expression levels; E: Umap plots showing distribution of each group of human clonal tissues; F: Bar plot showing the cell proportion distribution of each cell type in healthy and ulcerative colitis tissues; G: Bar plot showing the fold change level of cell proportion during lesion. CD4+ TC: CD4+ T cells; CD8+ TC: CD8+ T cells; NKT: Natural killer T cells; NK: Natural killer cells; BC: B cells; Pla: Plasmocytes; Mye: Myeloid cells; EC: Endothelial cells.
- Citation: Wang YF, He RY, Xu C, Li XL, Cao YF. Single-cell analysis identifies phospholysine phosphohistidine inorganic pyrophosphate phosphatase as a target in ulcerative colitis. World J Gastroenterol 2023; 29(48): 6222-6234
- URL: https://www.wjgnet.com/1007-9327/full/v29/i48/6222.htm
- DOI: https://dx.doi.org/10.3748/wjg.v29.i48.6222


