Copyright
©The Author(s) 2023.
World J Gastroenterol. Nov 28, 2023; 29(44): 5907-5918
Published online Nov 28, 2023. doi: 10.3748/wjg.v29.i44.5907
Published online Nov 28, 2023. doi: 10.3748/wjg.v29.i44.5907
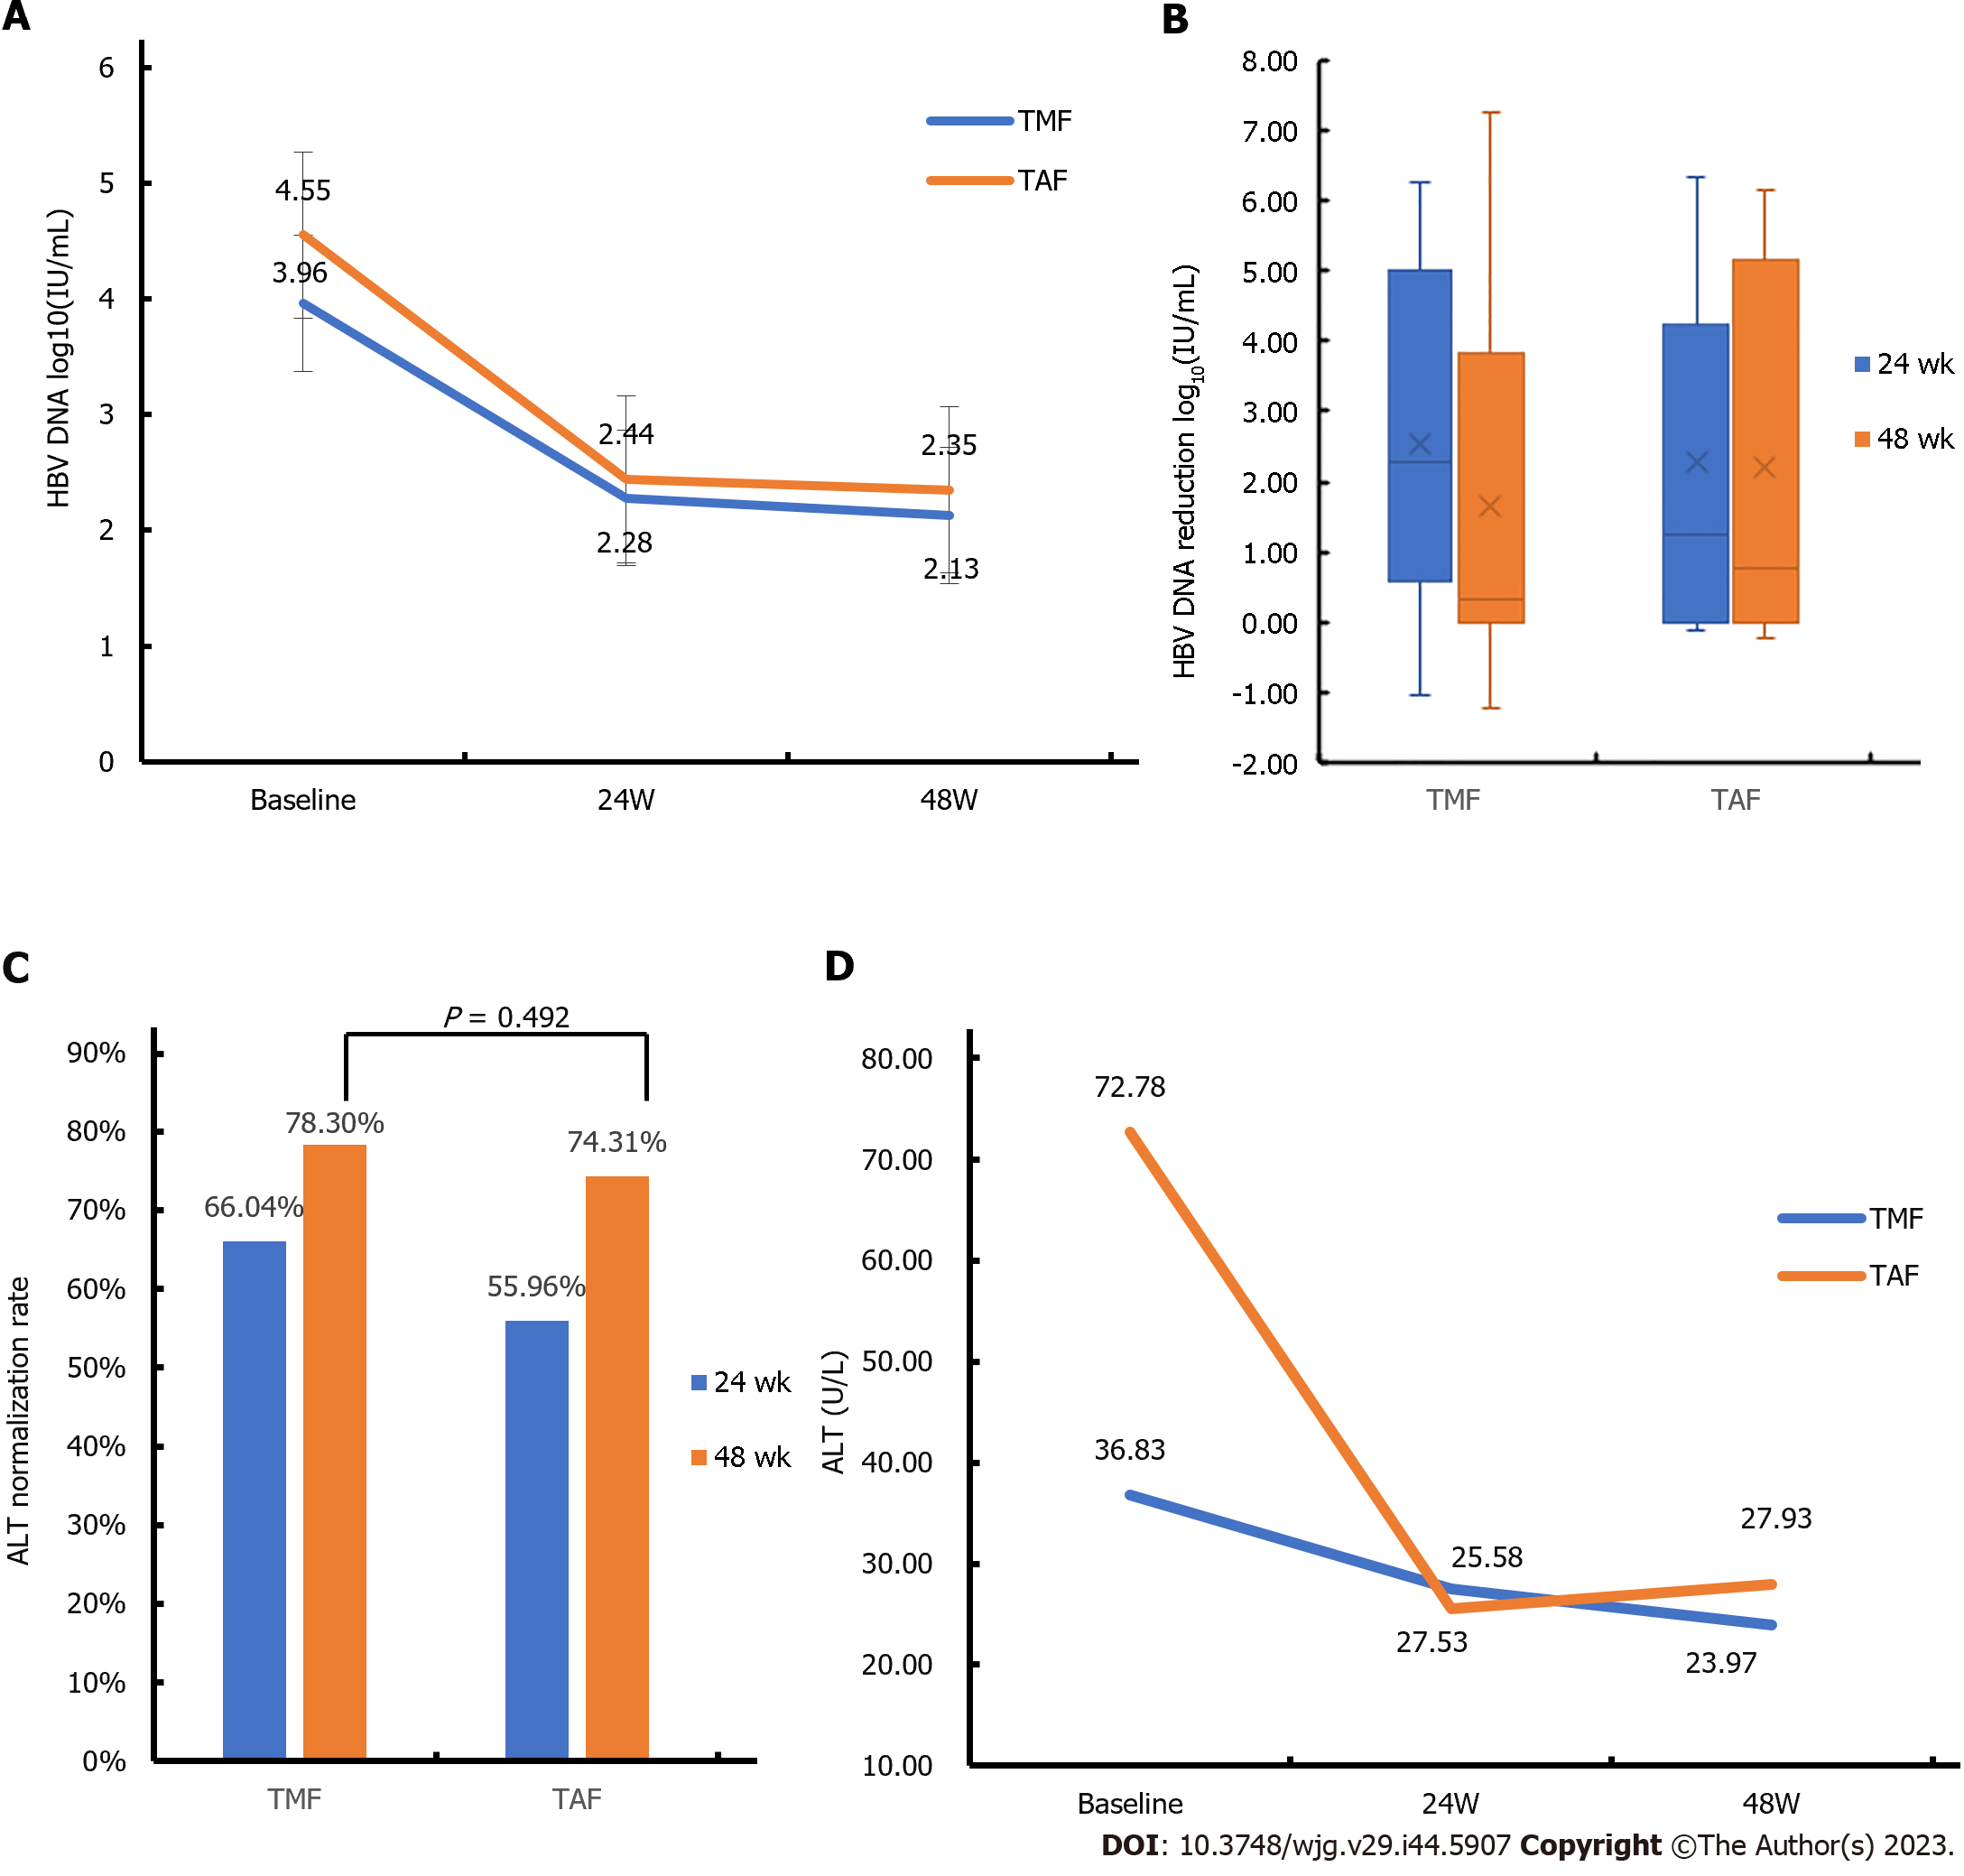
Figure 3 Comparison of changes in hepatitis B virus DNA level, the ratios of alanine aminotransferase normalization and alanine aminotransferase level between the tenofovir amibufenamide and tenofovir alafenamide groups.
A: Hepatitis B virus (HBV) DNA levels at baseline week, 24 wk and 48 wk in the tenofovir amibufenamide (TMF) and tenofovir alafenamide (TAF) groups; B: HBV-DNA reduction from 24 wk to 48 wk in the TMF and TAF groups; C: Alanine aminotransferase (ALT) normalization rate of TMF and TAF groups at 24 and 48 wk; D: ALT levels at baseline week, 24 wk and 48 wk in the TMF and TAF groups. TMF: Tenofovir amibufenamide; TAF: Tenofovir alafenamide; ALT: Alanine aminotransferase; HBV: Hepatitis B virus.
- Citation: Peng WT, Jiang C, Yang FL, Zhou NQ, Chen KY, Liu JQ, Peng SF, Fu L. Tenofovir amibufenamide vs tenofovir alafenamide for treating chronic hepatitis B: A real-world study. World J Gastroenterol 2023; 29(44): 5907-5918
- URL: https://www.wjgnet.com/1007-9327/full/v29/i44/5907.htm
- DOI: https://dx.doi.org/10.3748/wjg.v29.i44.5907


