Copyright
©The Author(s) 2023.
World J Gastroenterol. Nov 28, 2023; 29(44): 5872-5881
Published online Nov 28, 2023. doi: 10.3748/wjg.v29.i44.5872
Published online Nov 28, 2023. doi: 10.3748/wjg.v29.i44.5872
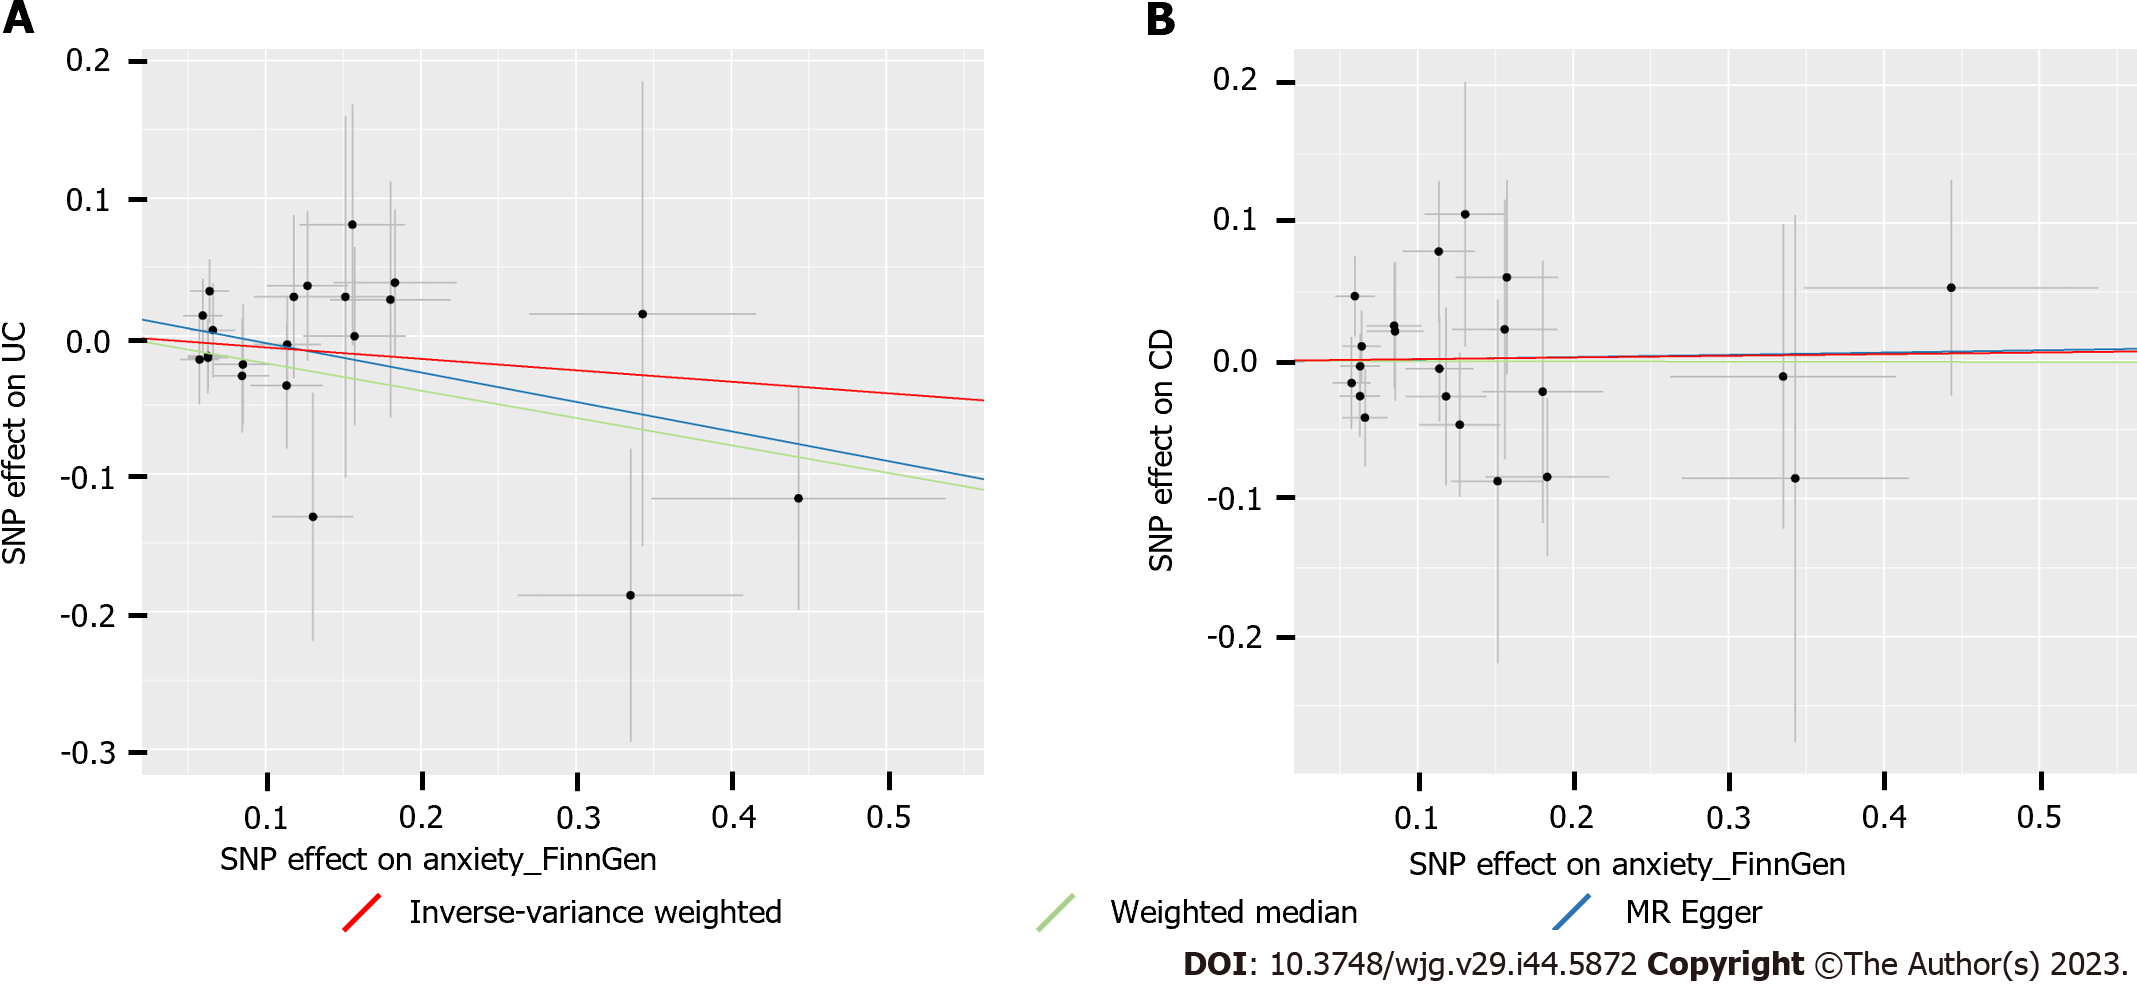
Figure 3 Scatter plots of Mendelian randomization analysis showing the effect of anxiety on ulcerative colitis and Crohn’s disease.
A: Analysis of anxiety and ulcerative colitis (UC); B: Analysis of anxiety and Crohn’s disease (CD). The x-axes represent the genetic instrument-anxiety associations, and the y-axes represent genetic instrument-UC or instrument-CD associations. Black dots denote the genetic instruments included in the primary Mendelian randomization (MR) analysis. Red: inverse-variance weighted; green: weighted median; blue: MR Egger. Due to the same estimate from the weighted median and MR Egger methods in some analyses, those figures only contain two lines. However, the color of the overlapped lines is darker than that of the MR Egger. CD: Crohn’s disease; UC: Ulcerative colitis; SNP: Single-nucleotide polymorphism.
- Citation: He Y, Chen CL, He J, Liu SD. Causal associations between inflammatory bowel disease and anxiety: A bidirectional Mendelian randomization study. World J Gastroenterol 2023; 29(44): 5872-5881
- URL: https://www.wjgnet.com/1007-9327/full/v29/i44/5872.htm
- DOI: https://dx.doi.org/10.3748/wjg.v29.i44.5872


