Copyright
©The Author(s) 2023.
World J Gastroenterol. Nov 14, 2023; 29(42): 5716-5727
Published online Nov 14, 2023. doi: 10.3748/wjg.v29.i42.5716
Published online Nov 14, 2023. doi: 10.3748/wjg.v29.i42.5716
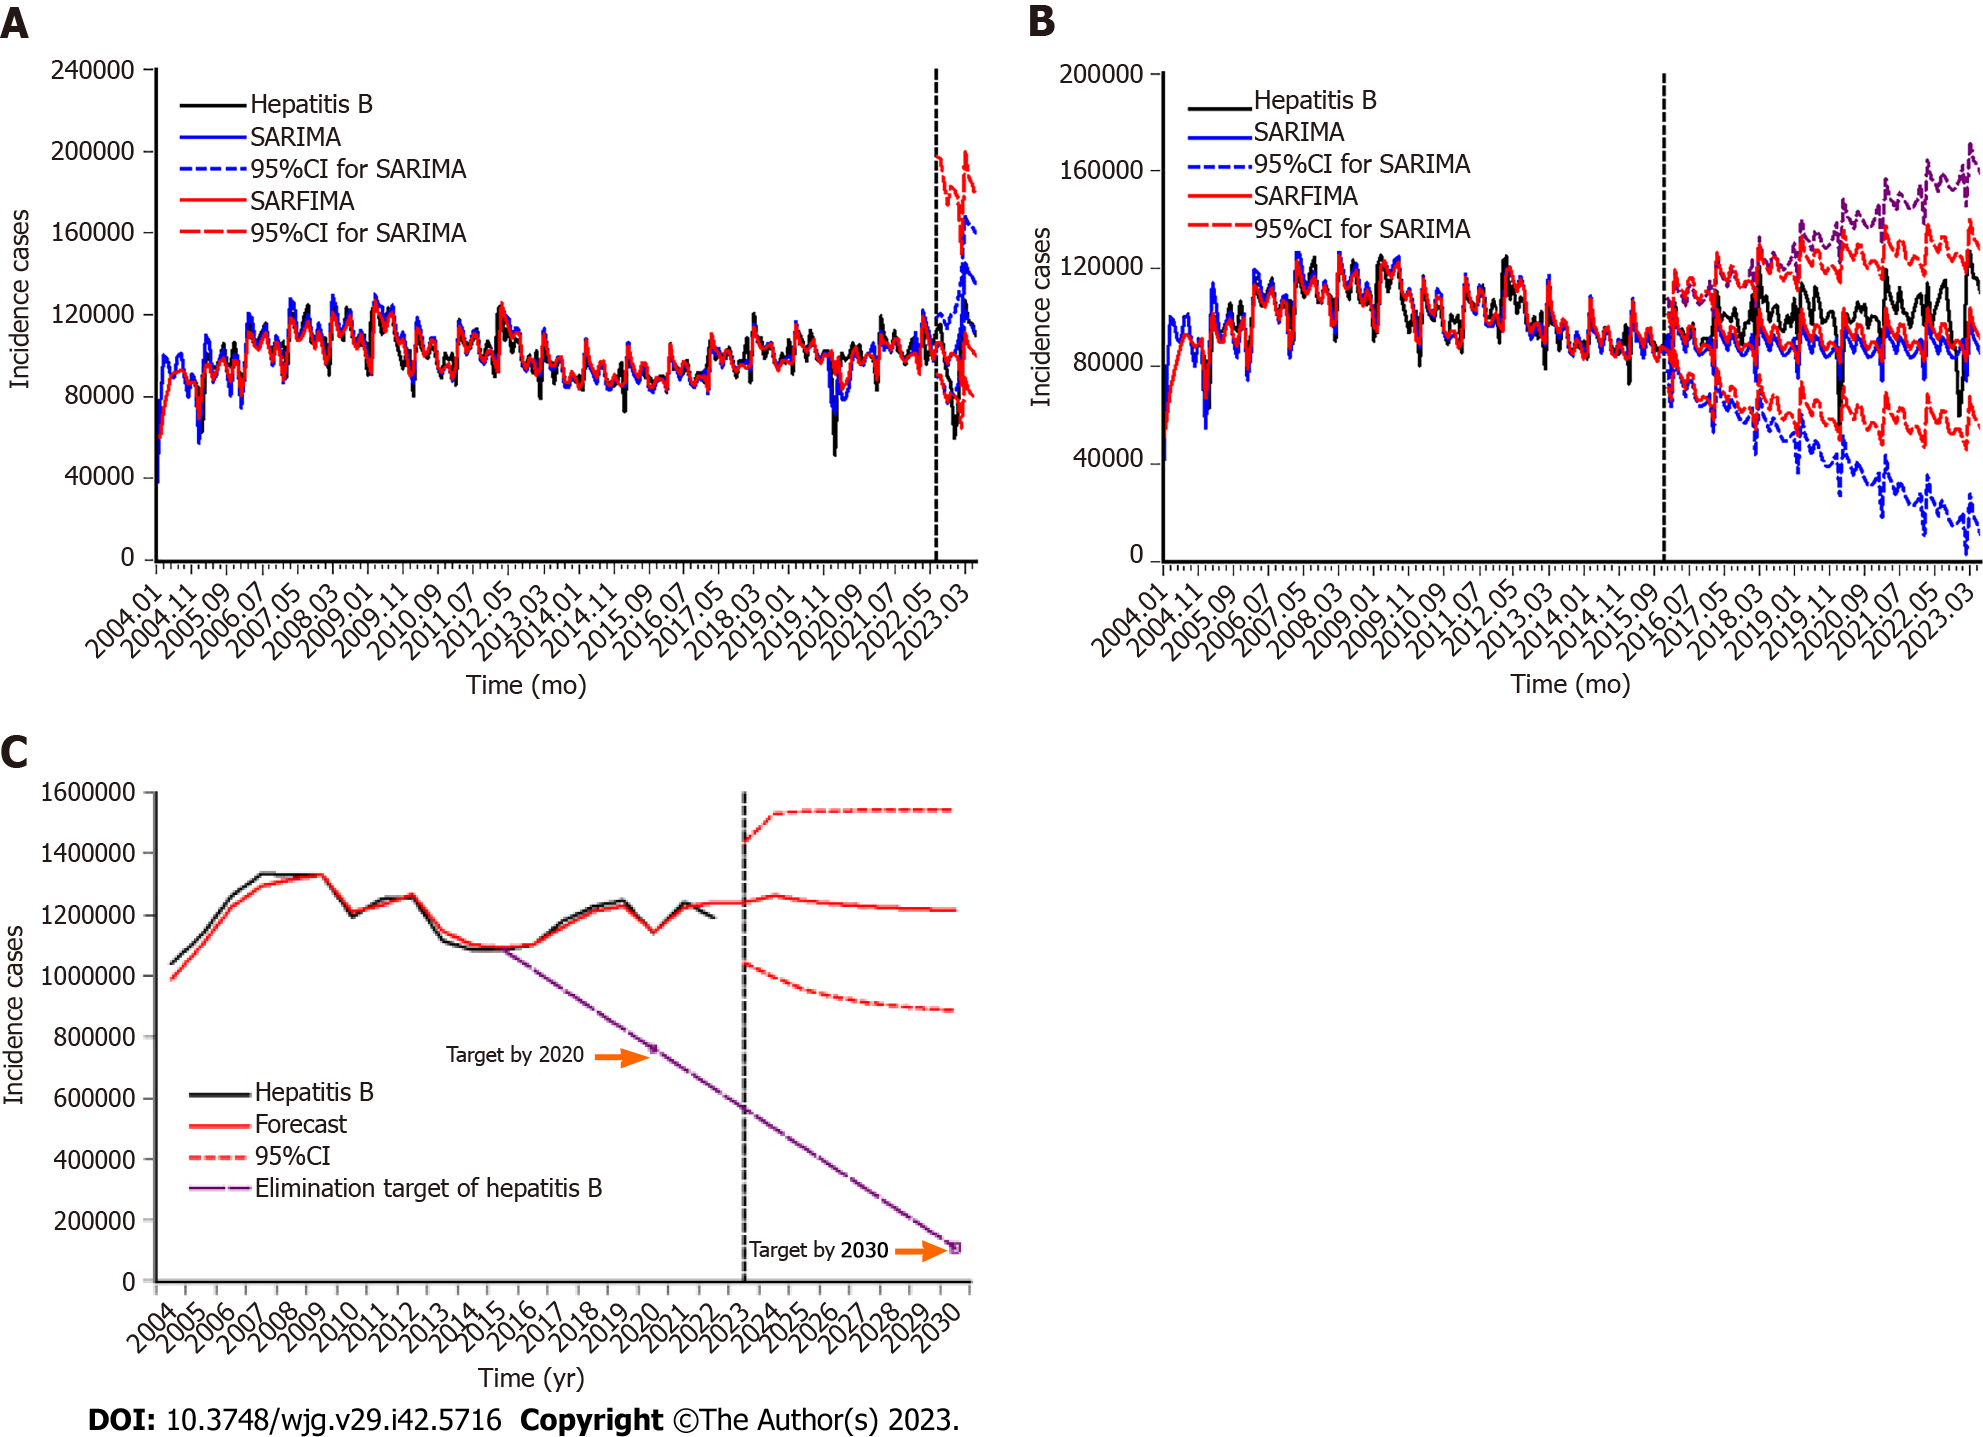
Figure 2 Comparison of the hepatitis B incidence cases with the forecasts under the seasonal autoregressive integrated moving average and seasonal autoregressive fractionally integrated moving average.
A: Comparison of the 12-step ahead forecasts under the seasonal autoregressive integrated moving average (SARIMA) and seasonal autoregressive fractionally integrated moving average (SARFIMA); B: Comparison of the 90-step ahead forecasts under the SARIMA and SARFIMA; C: Projection into 2030 under the SARFIMA. The predictive results are plotted in the right of the virtual vertical line. It seemed that the forecasts under the SARFIMA are in closer proximity to the actual hepatitis B incidence values and the predictive hepatitis B incidence curves would reach a plateau in the upcoming years. 95%CI: 95% confidence interval; SARFIMA: Seasonal autoregressive fractionally integrated moving average; SARIMA: Seasonal autoregressive integrated moving average.
- Citation: Wang YB, Qing SY, Liang ZY, Ma C, Bai YC, Xu CJ. Time series analysis-based seasonal autoregressive fractionally integrated moving average to estimate hepatitis B and C epidemics in China. World J Gastroenterol 2023; 29(42): 5716-5727
- URL: https://www.wjgnet.com/1007-9327/full/v29/i42/5716.htm
- DOI: https://dx.doi.org/10.3748/wjg.v29.i42.5716


