Copyright
©The Author(s) 2023.
World J Gastroenterol. Nov 14, 2023; 29(42): 5716-5727
Published online Nov 14, 2023. doi: 10.3748/wjg.v29.i42.5716
Published online Nov 14, 2023. doi: 10.3748/wjg.v29.i42.5716
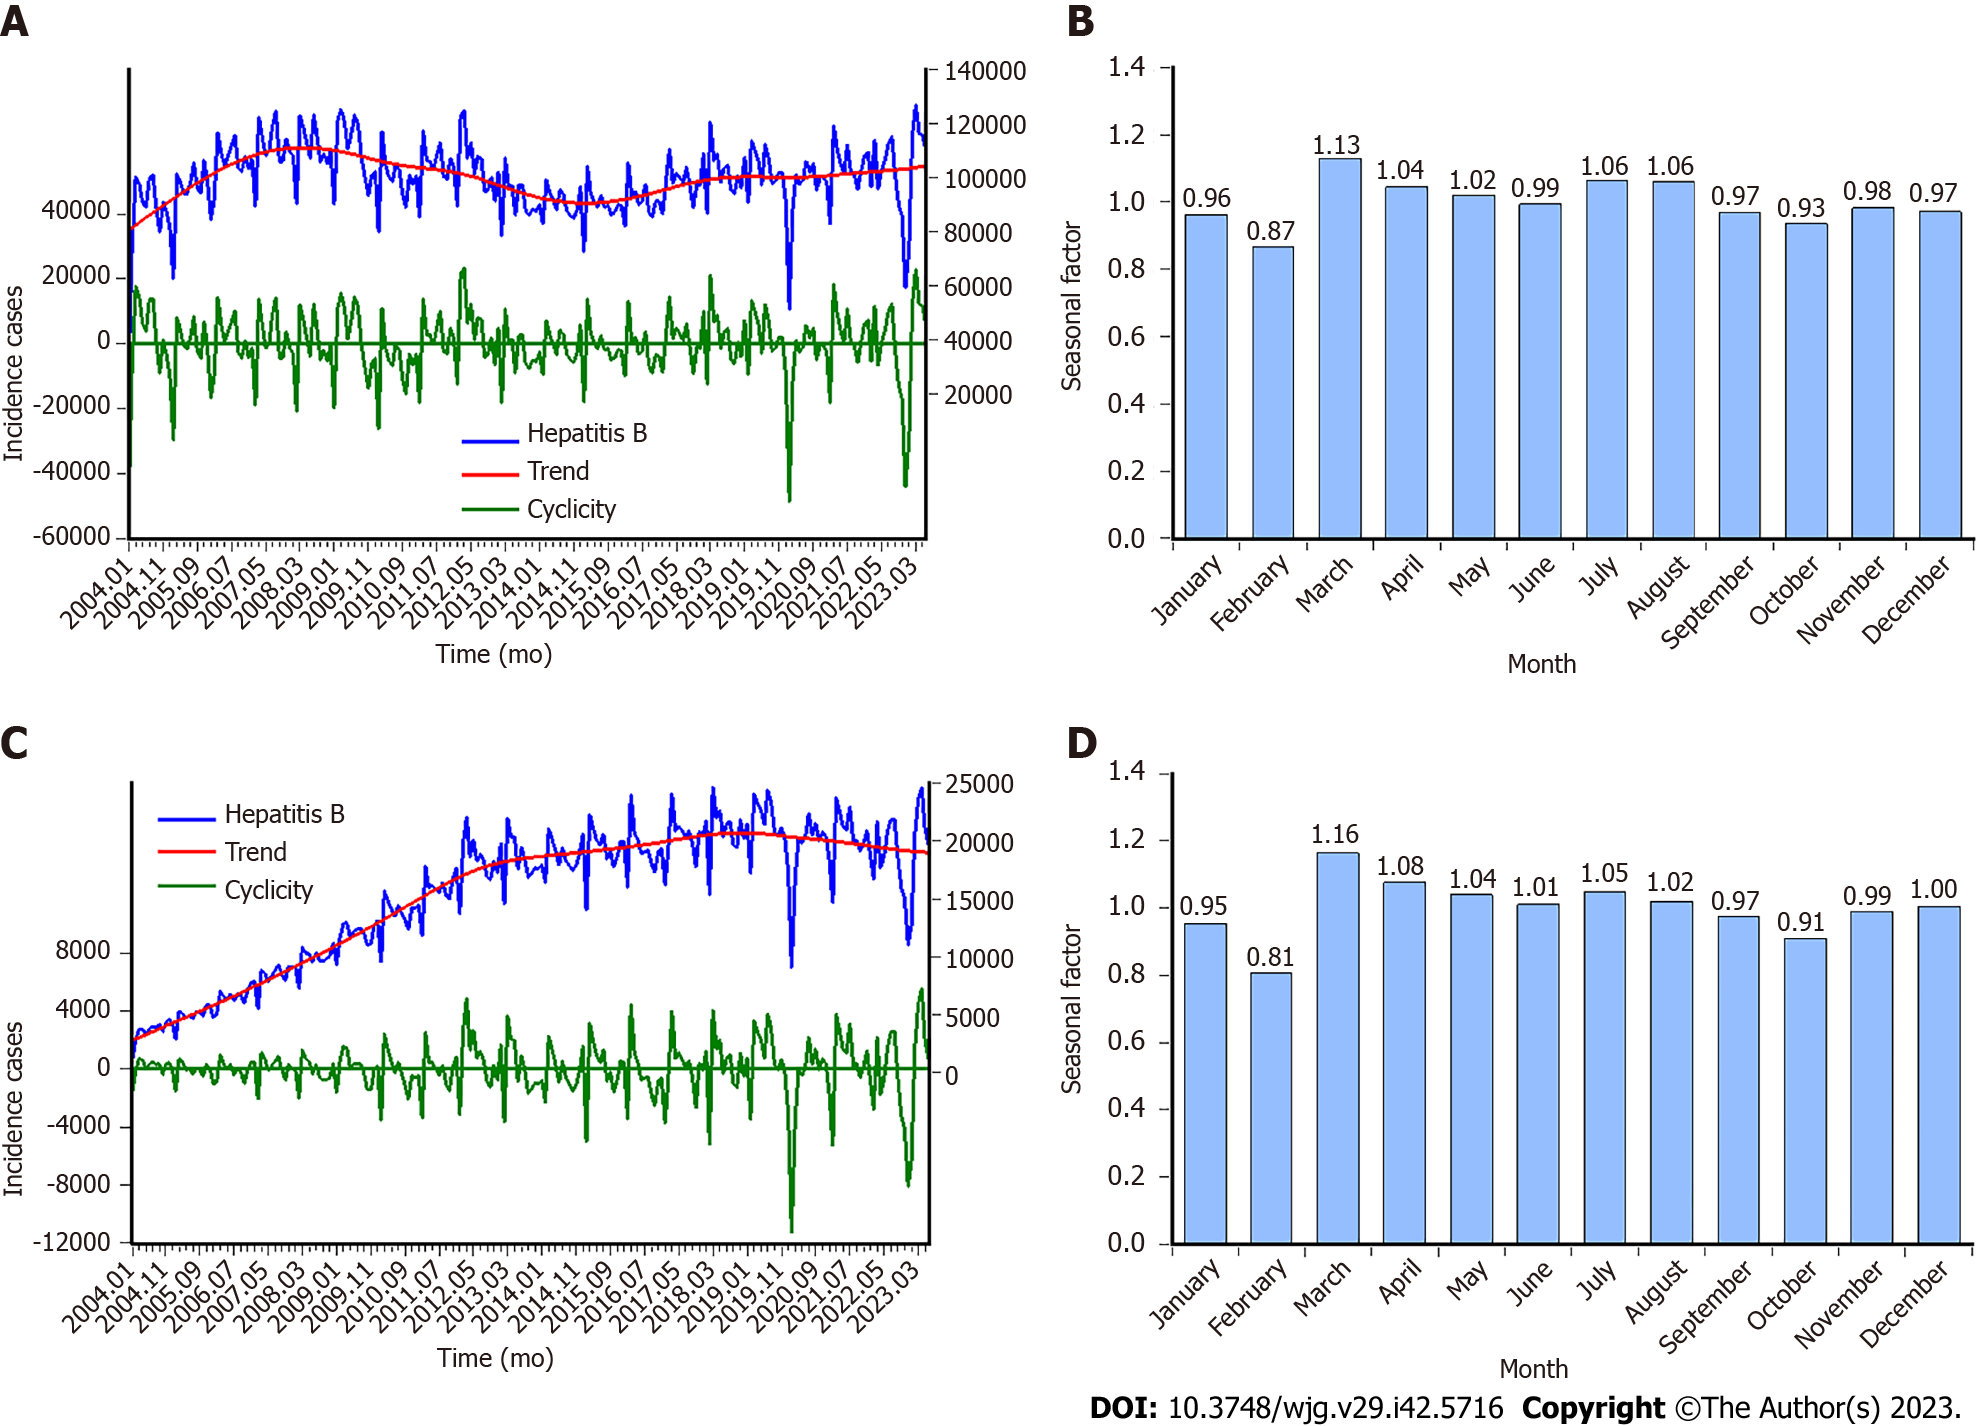
Figure 1 Time series graphs displaying the incidence cases, trend, cyclicity, and seasonality of hepatitis B and C.
A: Hepatitis B incidence cases and the decomposed trend and cyclicity by Hodrick-Prescott (HP) method; B: Seasonal factor for hepatitis B series; C: Hepatitis C incidence cases and the decomposed trend and cyclicity by HP method; D: Seasonal factor for hepatitis C series. It is clear that hepatitis B and C have the same seasonal patterns, a peak in March and a trough in February, and the other months remain relatively stable.
- Citation: Wang YB, Qing SY, Liang ZY, Ma C, Bai YC, Xu CJ. Time series analysis-based seasonal autoregressive fractionally integrated moving average to estimate hepatitis B and C epidemics in China. World J Gastroenterol 2023; 29(42): 5716-5727
- URL: https://www.wjgnet.com/1007-9327/full/v29/i42/5716.htm
- DOI: https://dx.doi.org/10.3748/wjg.v29.i42.5716


