Copyright
©The Author(s) 2023.
World J Gastroenterol. Nov 7, 2023; 29(41): 5641-5656
Published online Nov 7, 2023. doi: 10.3748/wjg.v29.i41.5641
Published online Nov 7, 2023. doi: 10.3748/wjg.v29.i41.5641
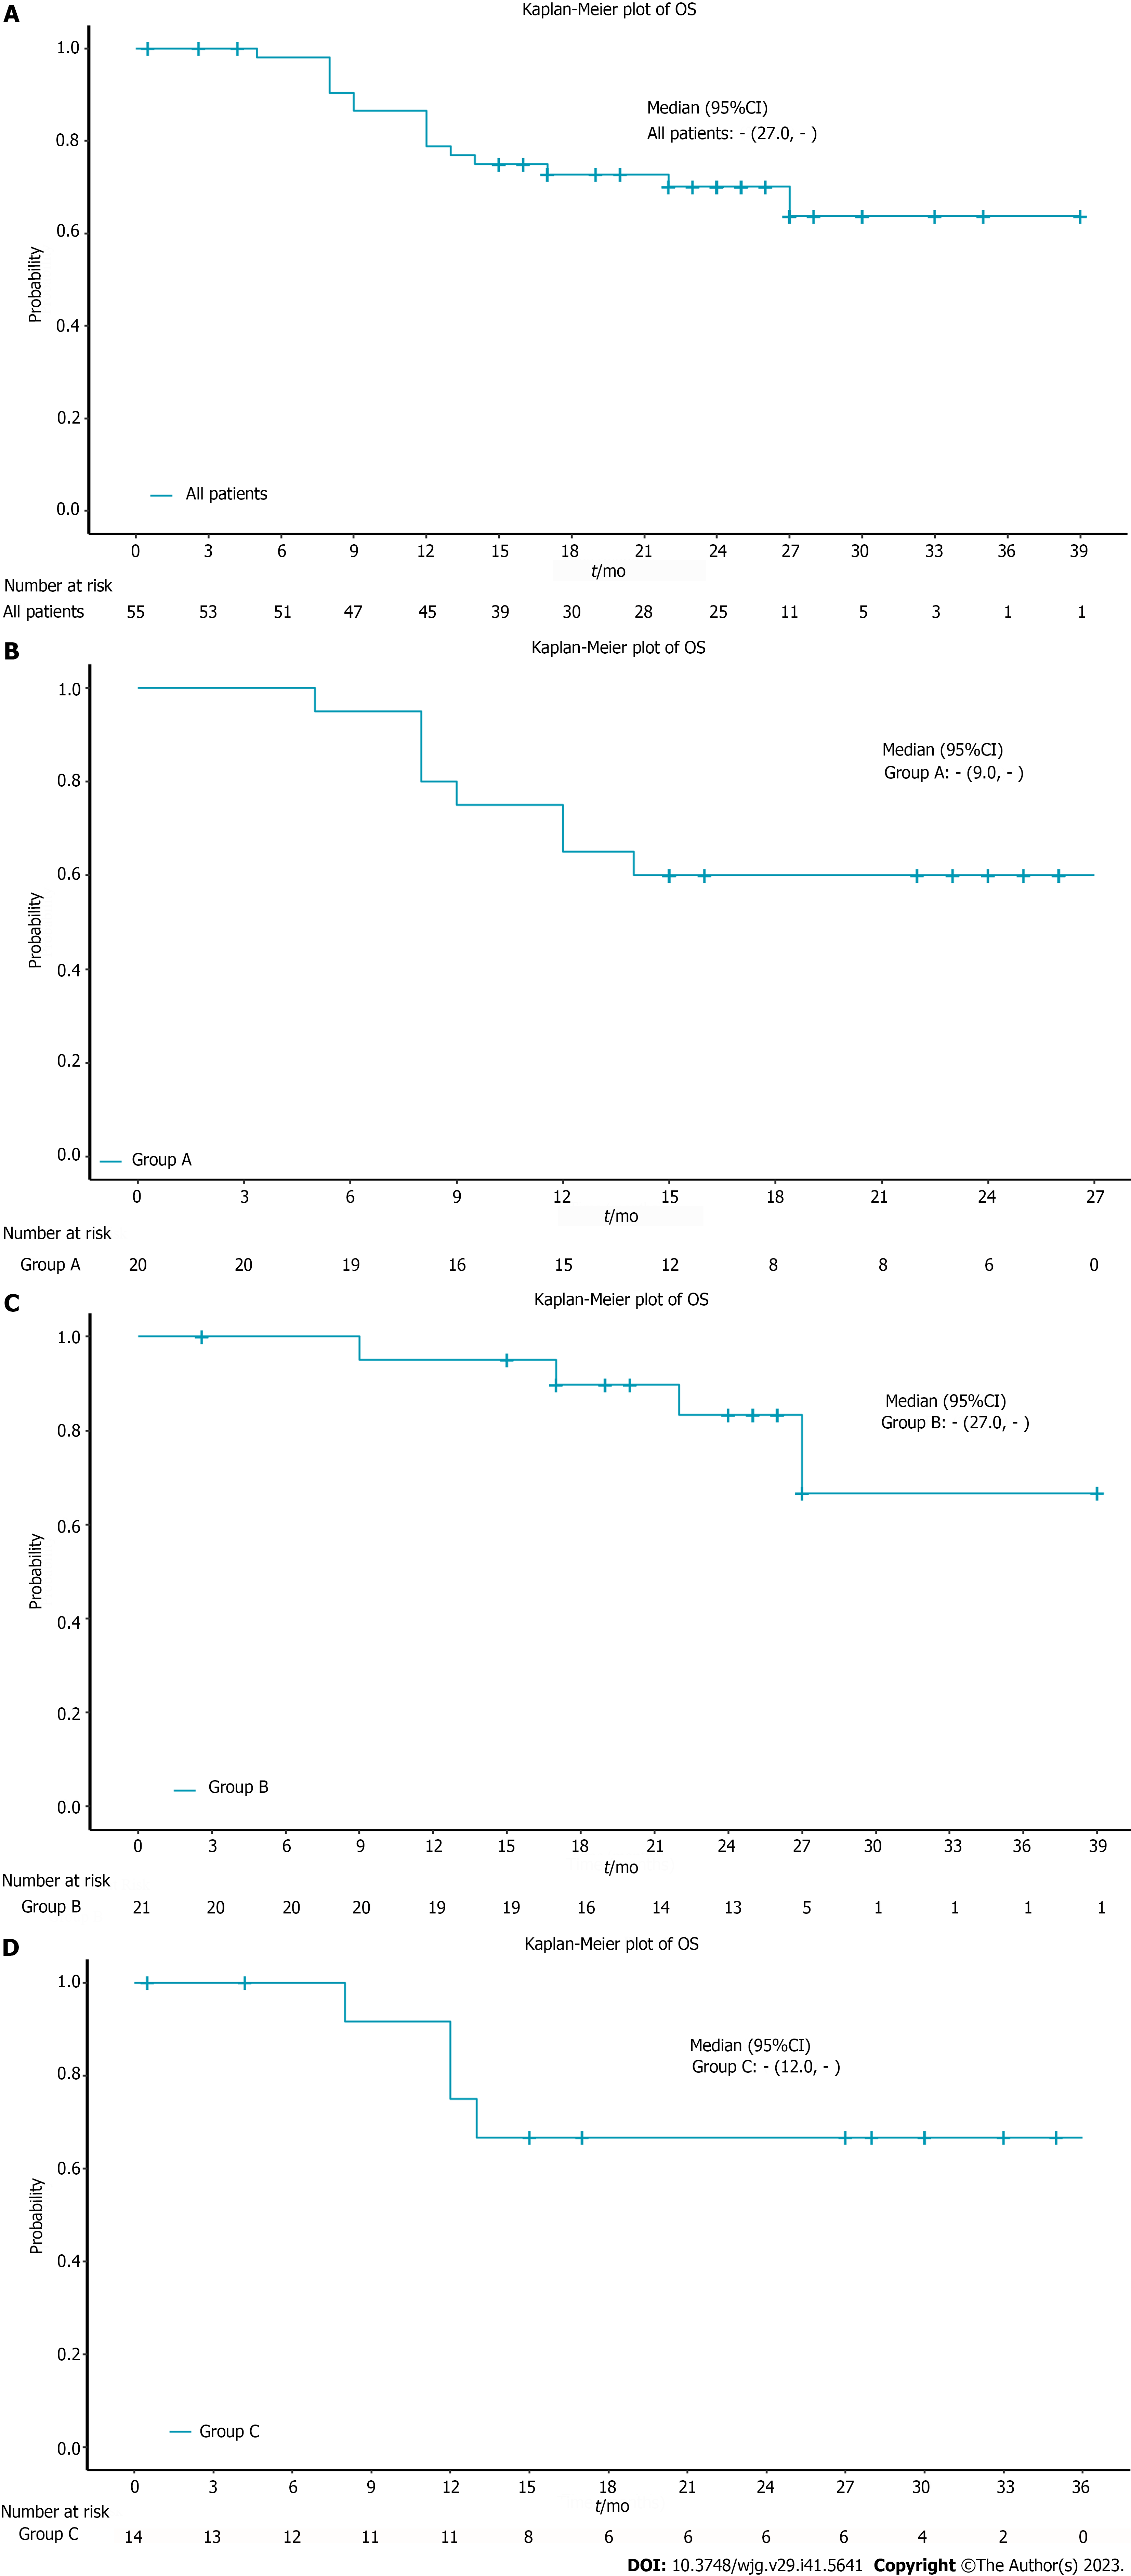
Figure 1 Kaplan-Meier plot of overall survival.
A: Kaplan-Meier plot of overall survival (OS) in all patients; B: Kaplan-Meier plot of OS in group A; C: Kaplan-Meier plot of OS in group B; D: Kaplan-Meier plot of OS in group C. Group A: Chemoradiotherapy plus pembrolizumab; Group B: Neoadjuvant therapy plus pembrolizumab; Group C: Chemotherapy plus pembrolizumab; OS: Overall survival; CI: Confidence interval.
- Citation: Wang HC, Huang X, Chen J, Li Y, Cong Y, Qu BL, Feng SQ, Liu F. Long-term efficacy and predictors of pembrolizumab-based regimens in patients with advanced esophageal cancer in the real world. World J Gastroenterol 2023; 29(41): 5641-5656
- URL: https://www.wjgnet.com/1007-9327/full/v29/i41/5641.htm
- DOI: https://dx.doi.org/10.3748/wjg.v29.i41.5641


