Copyright
©The Author(s) 2023.
World J Gastroenterol. Oct 28, 2023; 29(40): 5593-5617
Published online Oct 28, 2023. doi: 10.3748/wjg.v29.i40.5593
Published online Oct 28, 2023. doi: 10.3748/wjg.v29.i40.5593
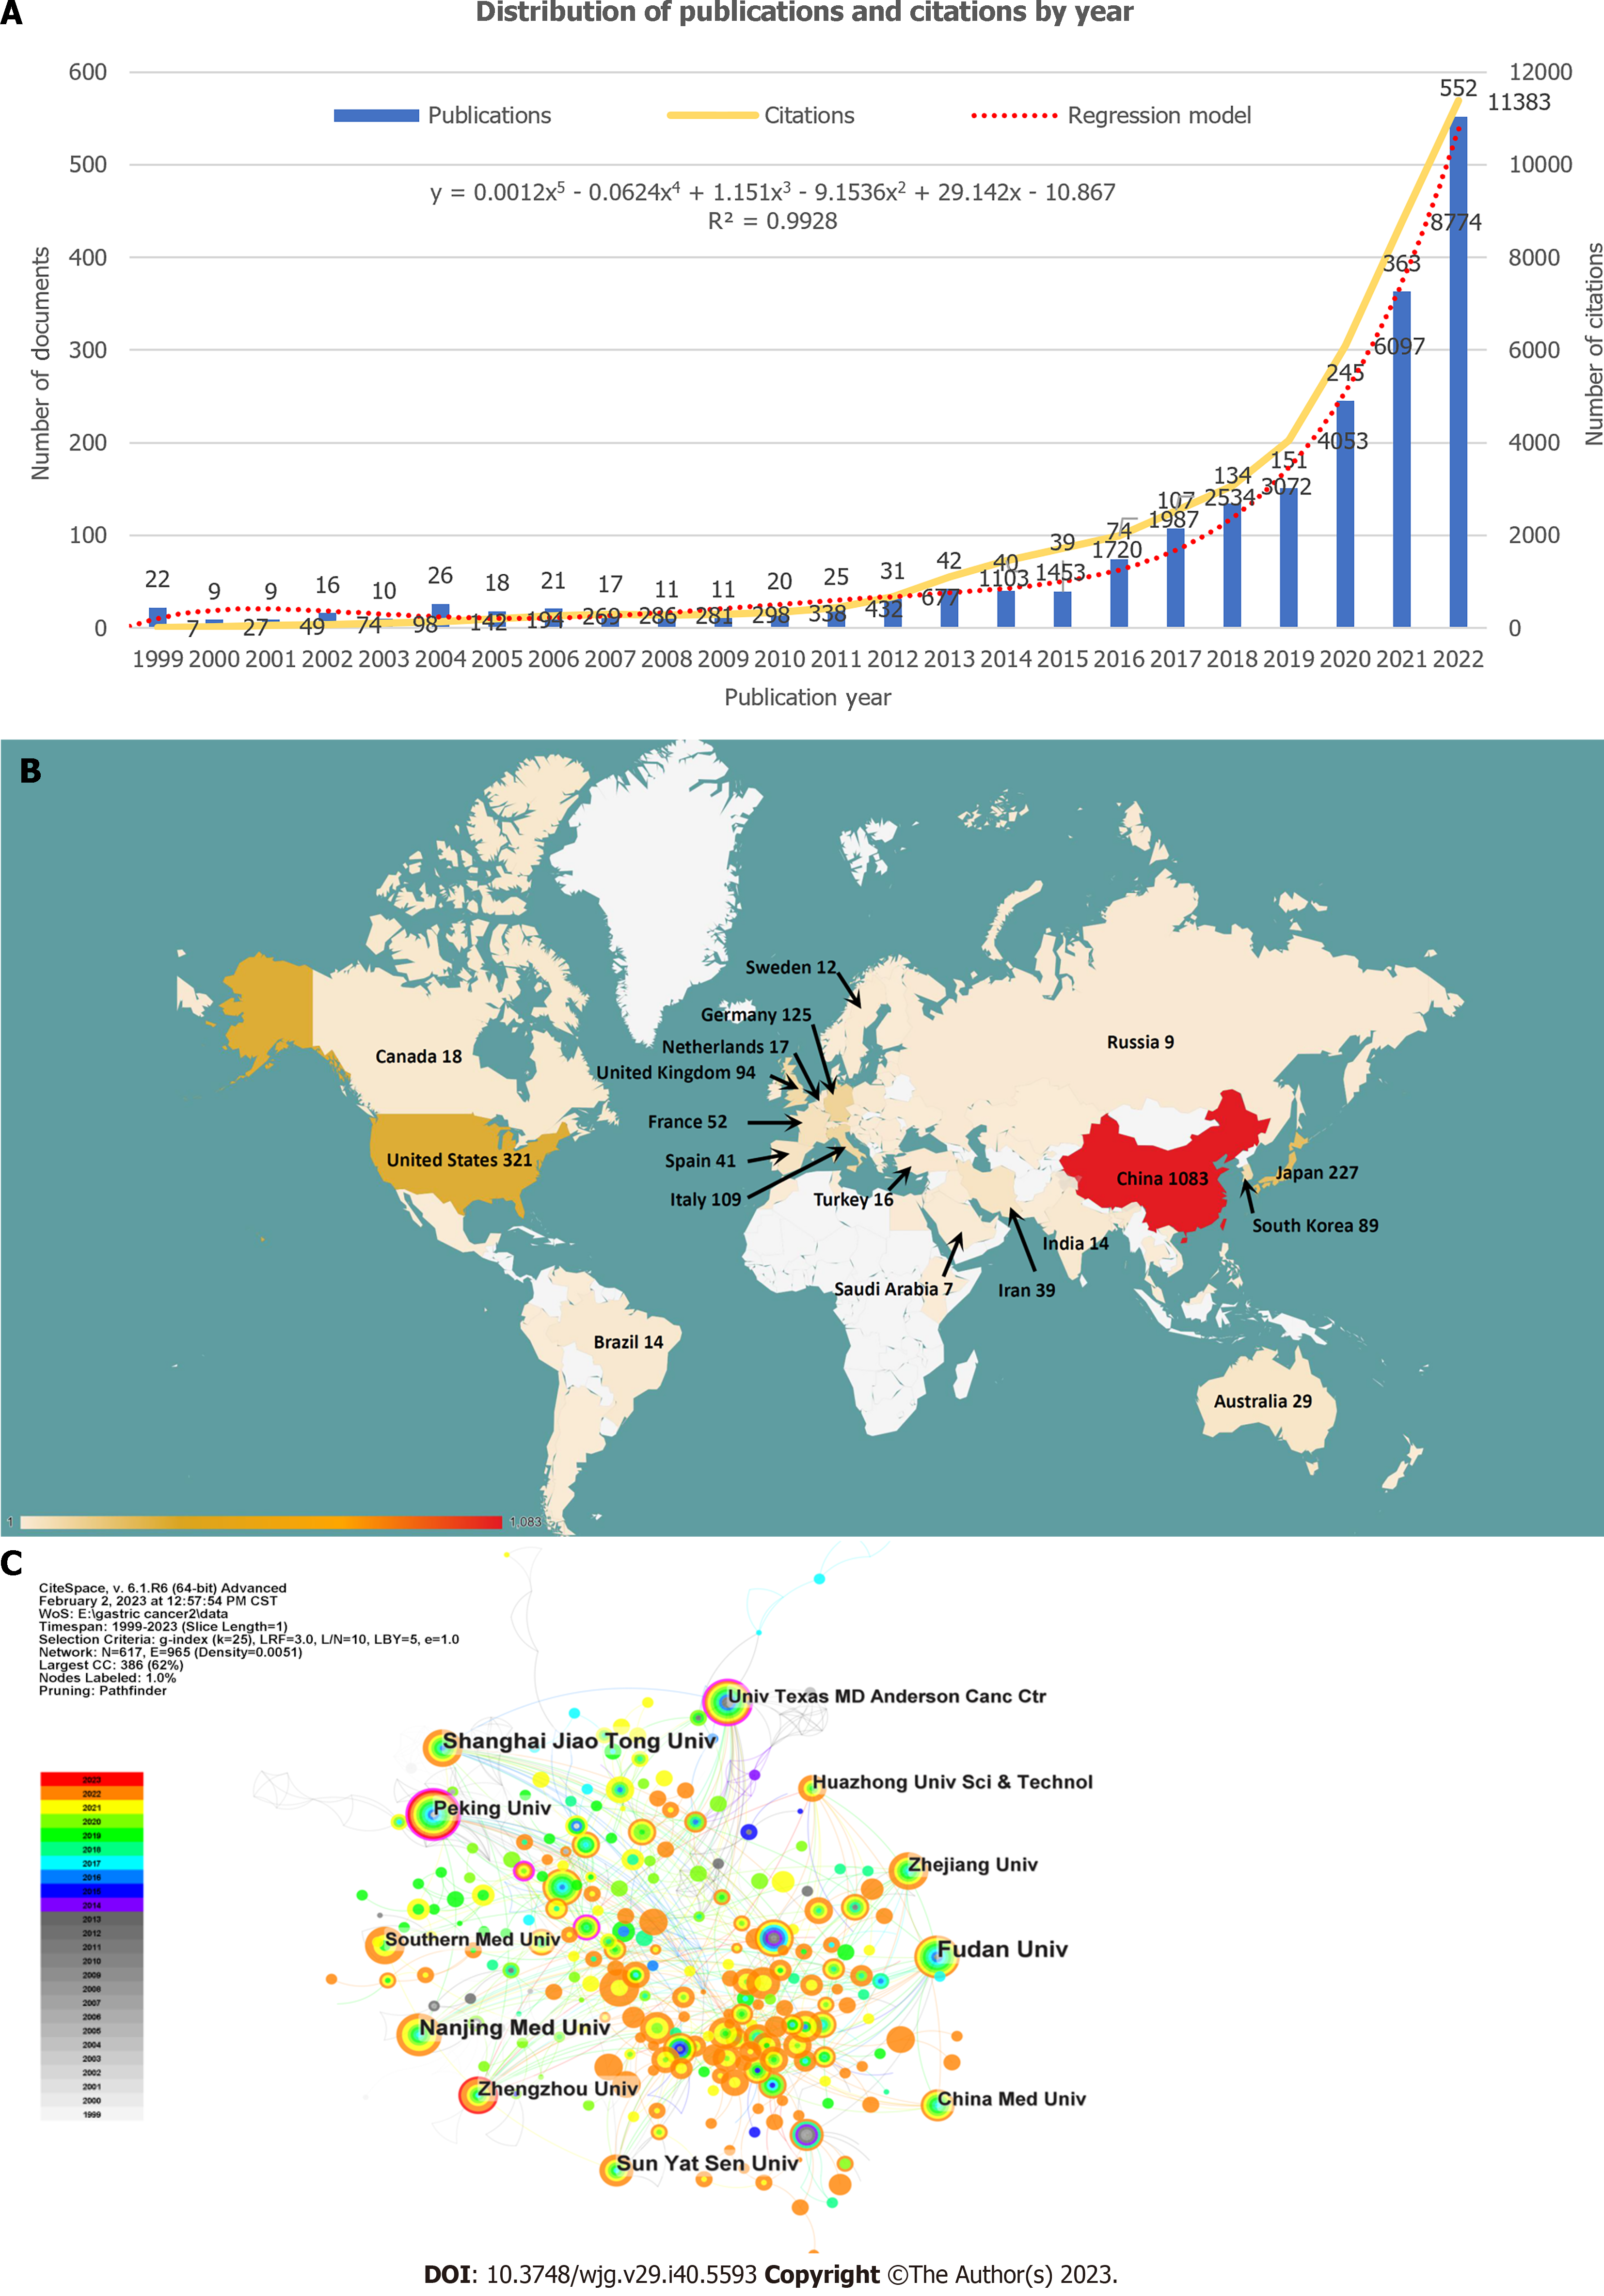
Figure 2 Annual distribution of publications and citations, geographical visualization, and institutions analysis.
A: Distribution of publications and citations by year. The regression formula is y = 0.0012x5 - 0.0624x4 + 1.151x3 - 9.1536x2 + 29.142x - 10.867, R² = 0.9928; B: Geographical visualization of publications for immunotherapy in gastric cancer; C: Co-occurrence map of the research institutions.
- Citation: Li YN, Xie B, Zhang Y, He MH, Xing Y, Mu DM, Wang H, Guo R. Advances and key focus areas in gastric cancer immunotherapy: A comprehensive scientometric and clinical trial review (1999-2023). World J Gastroenterol 2023; 29(40): 5593-5617
- URL: https://www.wjgnet.com/1007-9327/full/v29/i40/5593.htm
- DOI: https://dx.doi.org/10.3748/wjg.v29.i40.5593


