Copyright
©The Author(s) 2023.
World J Gastroenterol. Oct 28, 2023; 29(40): 5582-5592
Published online Oct 28, 2023. doi: 10.3748/wjg.v29.i40.5582
Published online Oct 28, 2023. doi: 10.3748/wjg.v29.i40.5582
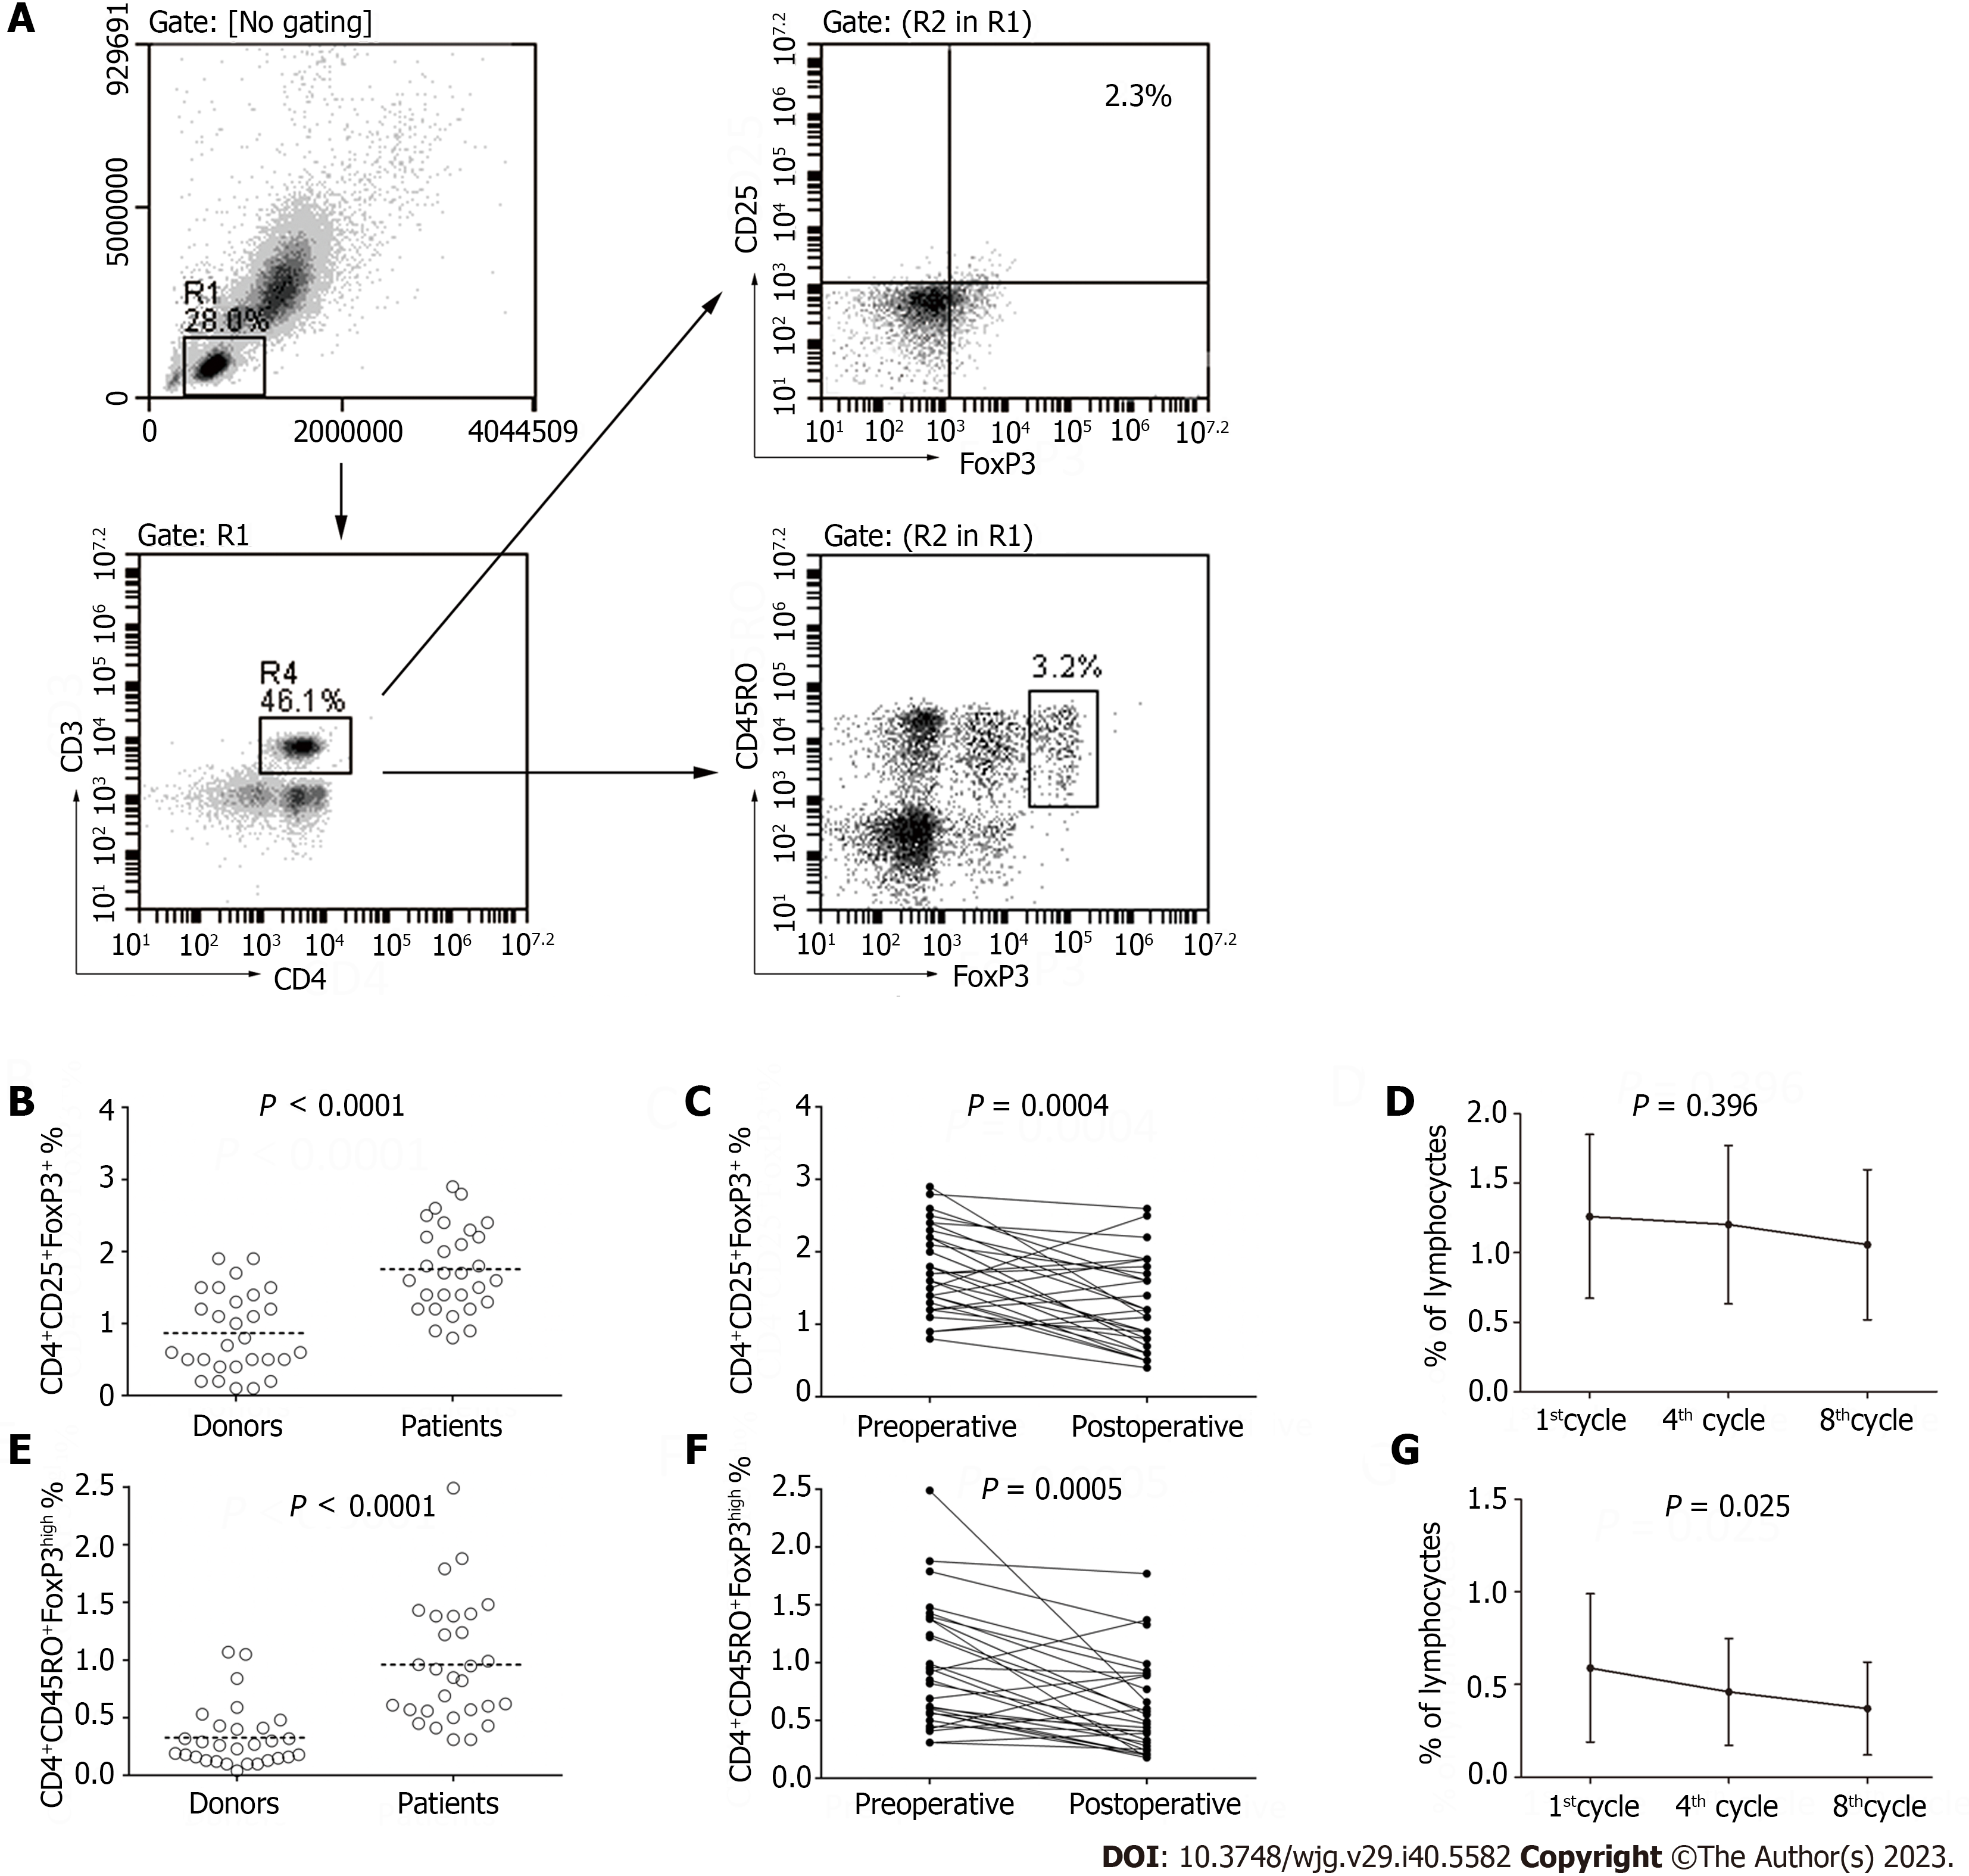
Figure 4 Treg and activated Treg cells in the peripheral blood of donors and patients.
A: Scatter plots are shown from one representative patient. Relationships of the diagrams are denoted with arrows and gates; B-G: The percent of TCD4+CD25+FoxP3+ and CD4+CD45RO+FoxP3high cells in the peripheral lymphocytes from the donors and patients during treatment were shown and the P value was calculated using an analysis of variance repeated-measures function.
- Citation: Li H, Cao GM, Gu GL, Li SY, Yan Y, Fu Z, Du XH. Expression characteristics of peripheral lymphocyte programmed death 1 and FoxP3+ Tregs in gastric cancer during surgery and chemotherapy. World J Gastroenterol 2023; 29(40): 5582-5592
- URL: https://www.wjgnet.com/1007-9327/full/v29/i40/5582.htm
- DOI: https://dx.doi.org/10.3748/wjg.v29.i40.5582


