Copyright
©The Author(s) 2023.
World J Gastroenterol. Oct 28, 2023; 29(40): 5582-5592
Published online Oct 28, 2023. doi: 10.3748/wjg.v29.i40.5582
Published online Oct 28, 2023. doi: 10.3748/wjg.v29.i40.5582
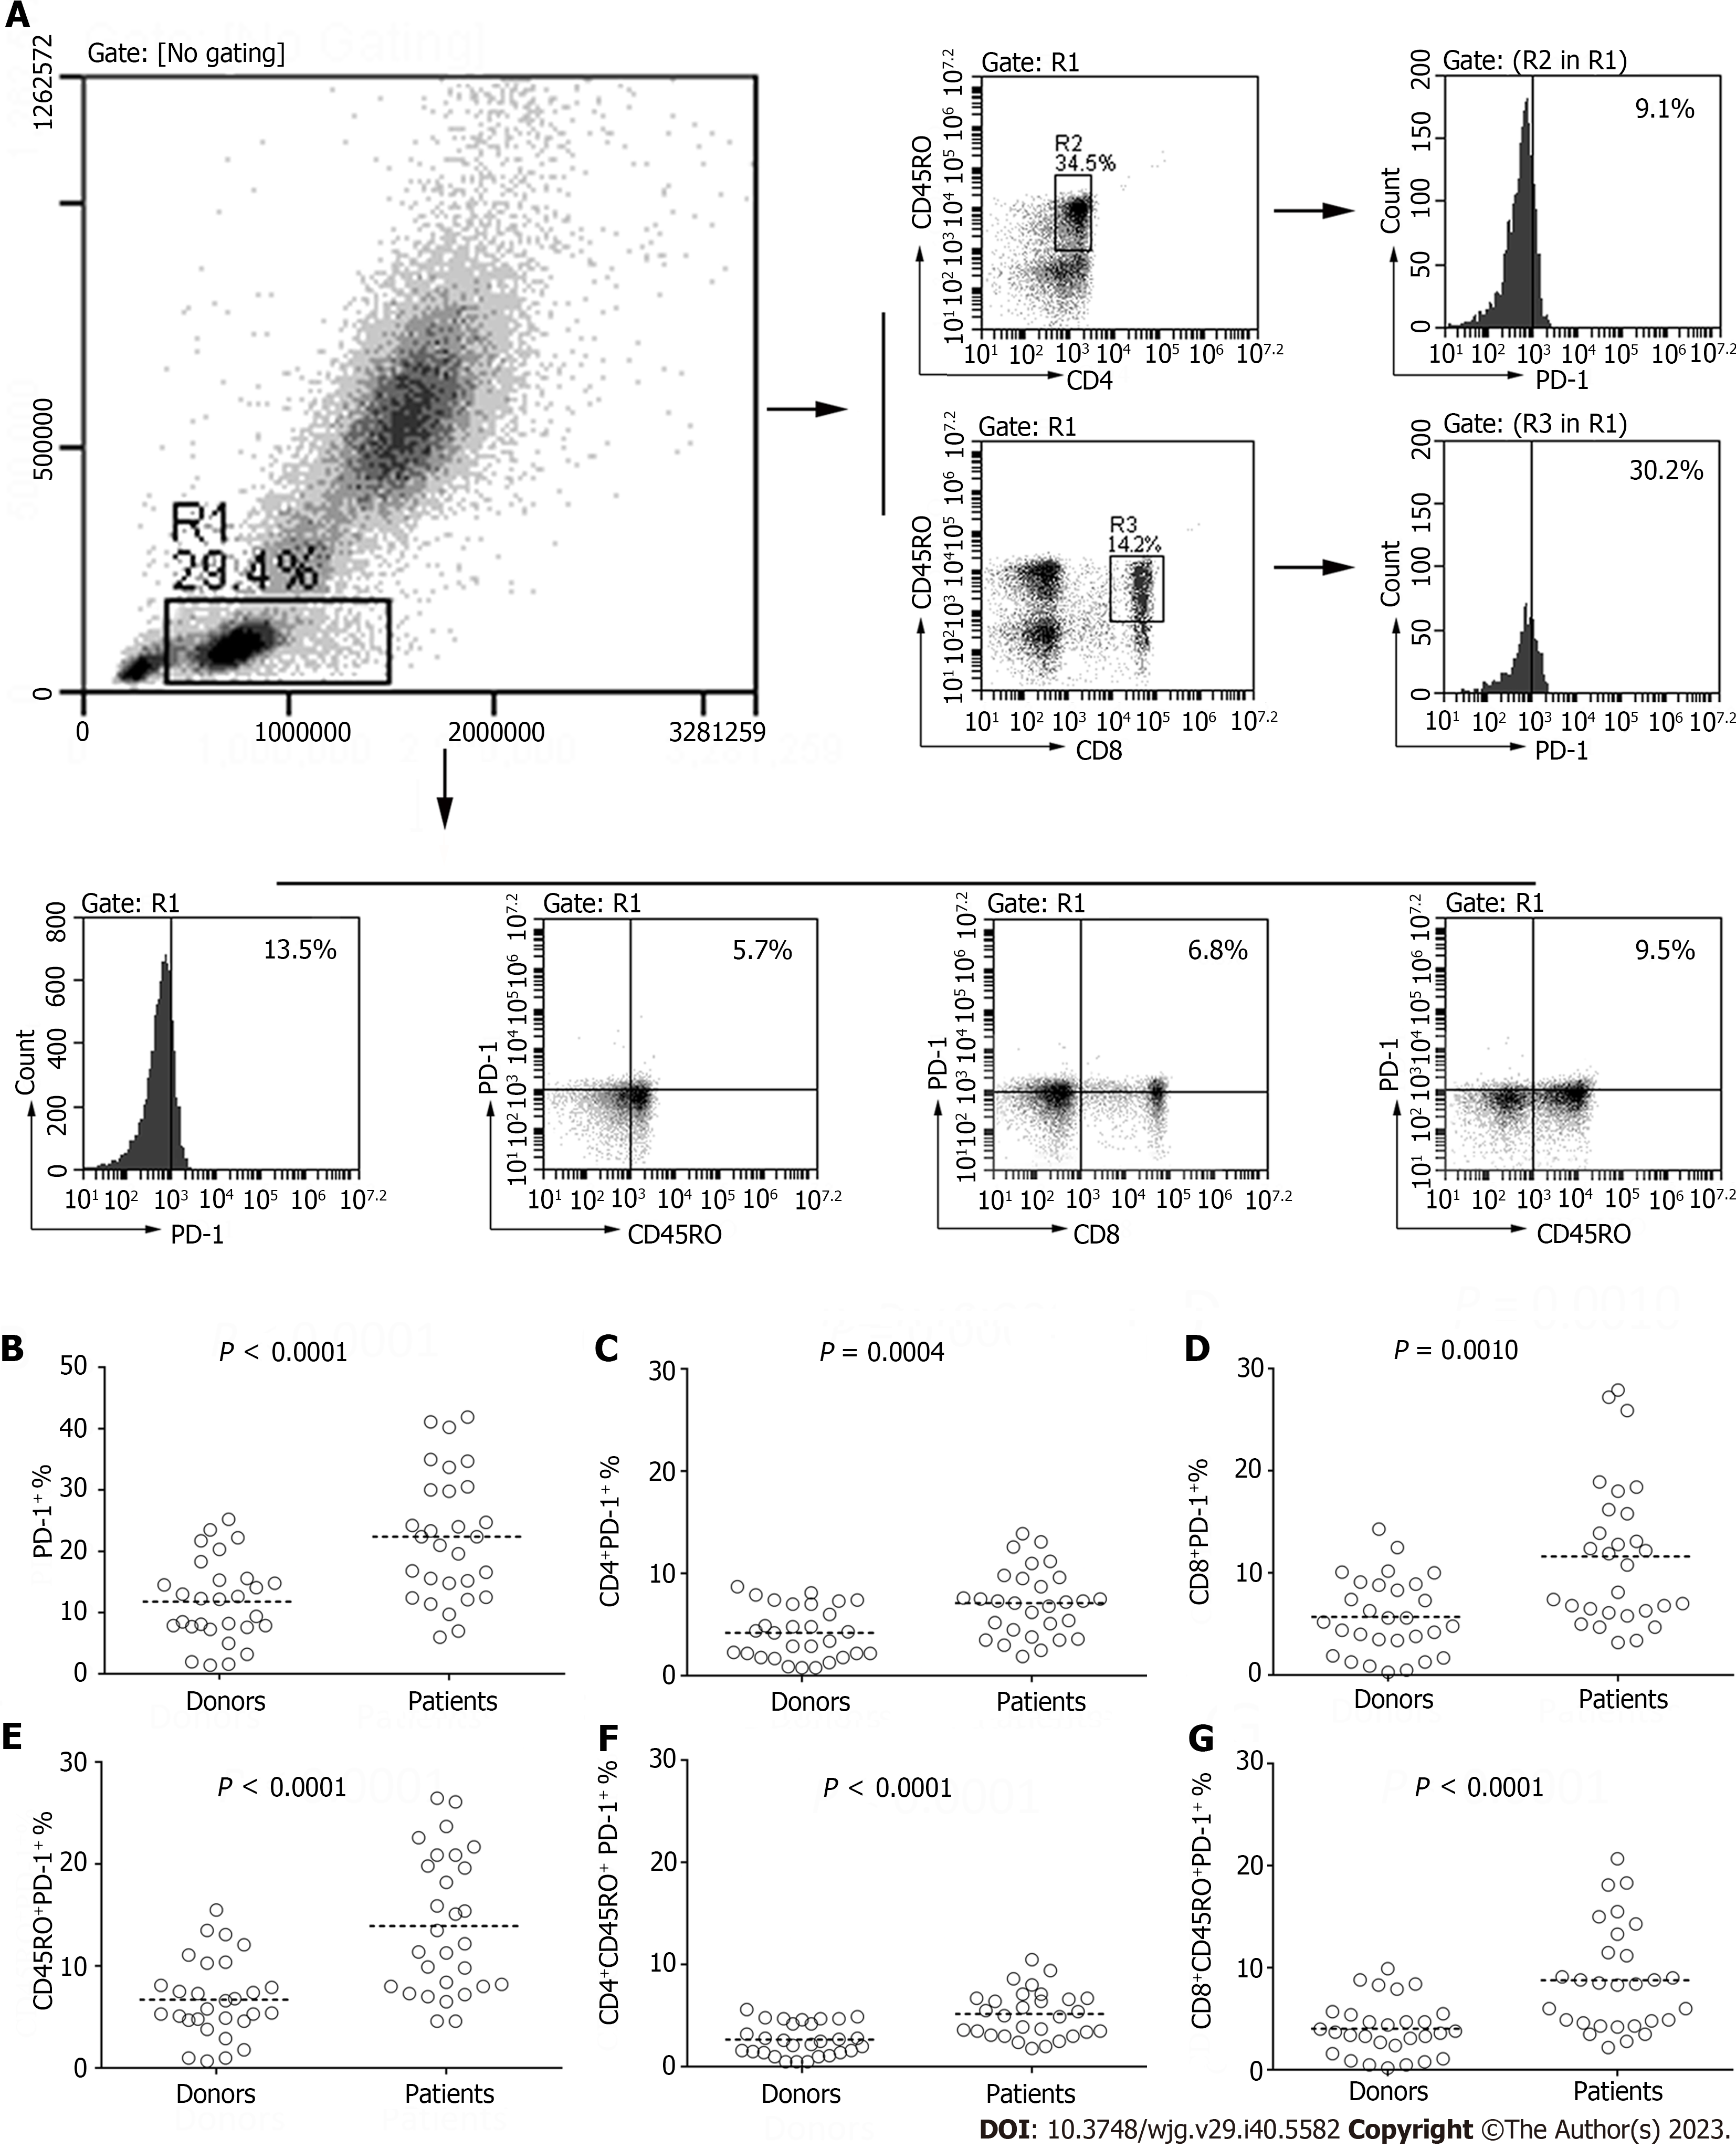
Figure 1 Programmed death 1 expression on all T cell subsets of healthy donors and preoperative patients with gastric cancer.
A: The scatter and histogram plots of one representative patient are illustrated. The relationships between the diagrams are indicated by arrows and gates (R1, R2, and R3); B-G: The percentages of total programmed death 1+ (PD-1+) cells (B), CD4+PD-1+ (C), CD8+PD-1+ (D), CD45RO+PD-1+ (E), CD4+CD45RO+PD-1+ (F), and CD8+CD45RO+PD-1+ (G) cells out of the total peripheral lymphocytes from patients and healthy donors are shown. The P value was calculated using a Student’s t-test or Wilcoxon rank sum test.
- Citation: Li H, Cao GM, Gu GL, Li SY, Yan Y, Fu Z, Du XH. Expression characteristics of peripheral lymphocyte programmed death 1 and FoxP3+ Tregs in gastric cancer during surgery and chemotherapy. World J Gastroenterol 2023; 29(40): 5582-5592
- URL: https://www.wjgnet.com/1007-9327/full/v29/i40/5582.htm
- DOI: https://dx.doi.org/10.3748/wjg.v29.i40.5582


