Copyright
©The Author(s) 2023.
World J Gastroenterol. Jan 28, 2023; 29(4): 706-730
Published online Jan 28, 2023. doi: 10.3748/wjg.v29.i4.706
Published online Jan 28, 2023. doi: 10.3748/wjg.v29.i4.706
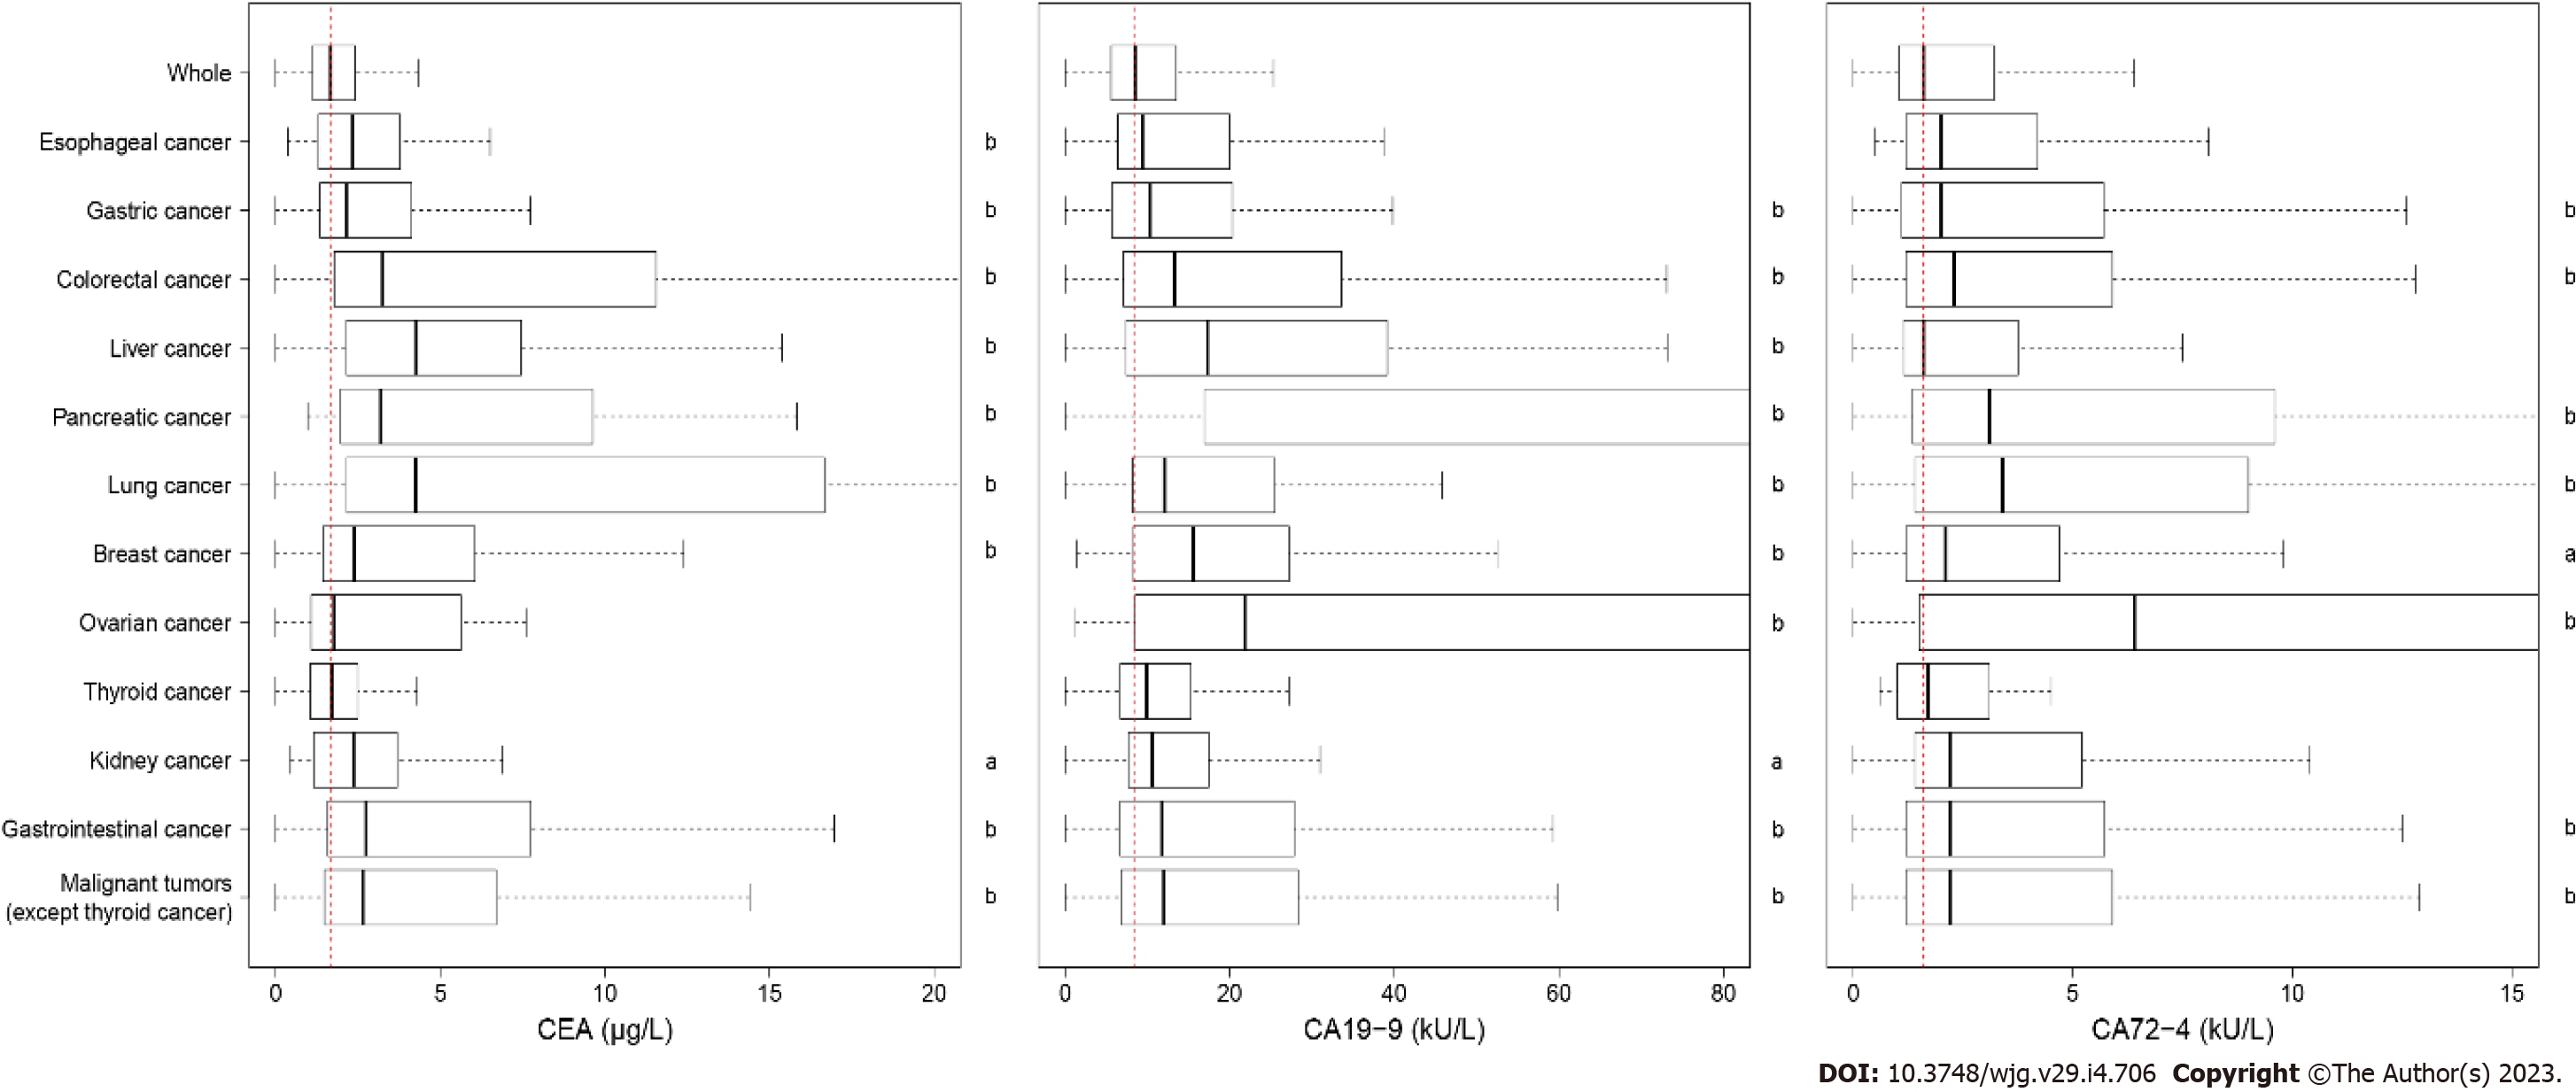
Figure 3 Boxplots of biomarker levels of malignant tumors.
The red dotted line is the biomarker level for all subjects. The P value was calculated between the malignant tumor patients and the subjects without any malignant tumors by the Wilcoxon test. aP < 0.05, bP < 0.01. CEA: Carcinoembryonic antigen; CA 19-9: Carbohydrate antigen 19-9; CA 72-4: Carbohydrate antigen 72-4.
- Citation: Liu HN, Yao C, Wang XF, Zhang NP, Chen YJ, Pan D, Zhao GP, Shen XZ, Wu H, Liu TT. Diagnostic and economic value of carcinoembryonic antigen, carbohydrate antigen 19-9, and carbohydrate antigen 72-4 in gastrointestinal cancers. World J Gastroenterol 2023; 29(4): 706-730
- URL: https://www.wjgnet.com/1007-9327/full/v29/i4/706.htm
- DOI: https://dx.doi.org/10.3748/wjg.v29.i4.706


