Copyright
©The Author(s) 2023.
World J Gastroenterol. Oct 21, 2023; 29(39): 5471-5482
Published online Oct 21, 2023. doi: 10.3748/wjg.v29.i39.5471
Published online Oct 21, 2023. doi: 10.3748/wjg.v29.i39.5471
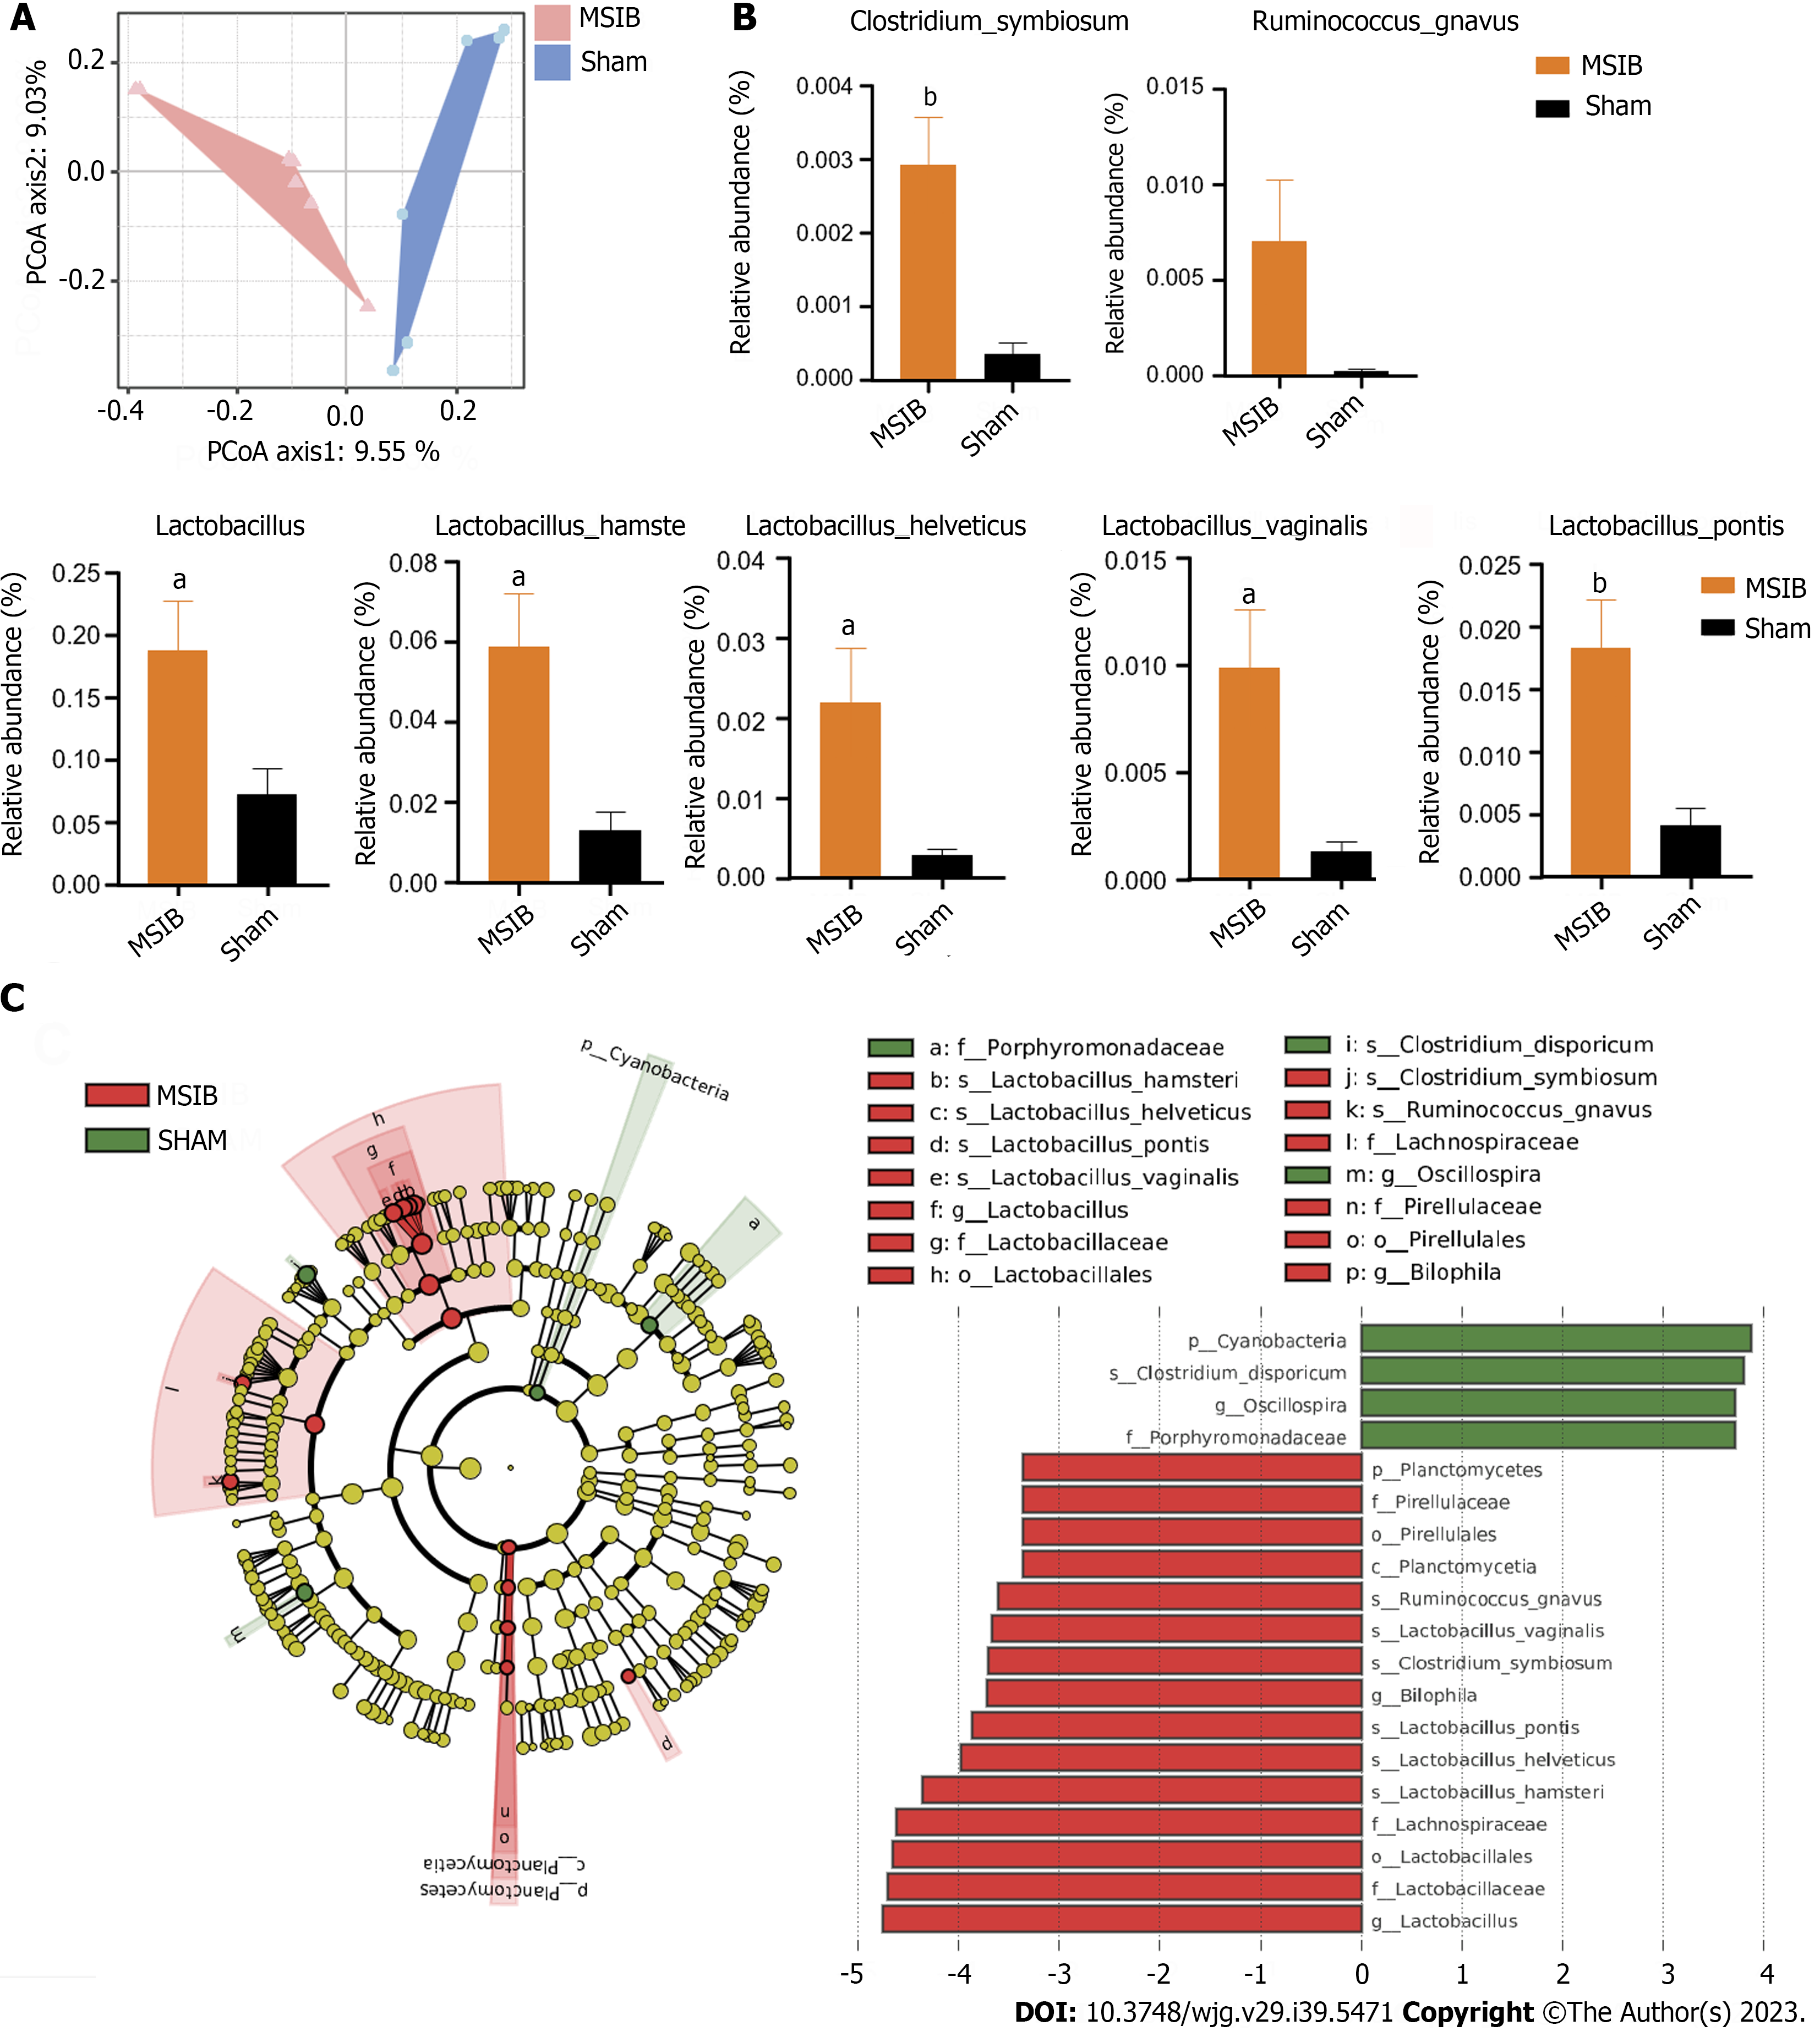
Figure 4 Changes in gut microbiota after mid-small intestine bypass.
A: Principal coordinate analysis of gut microbiota based on OUT data from mid-small intestine bypass (MSIB) and sham groups; B: Bacteria with increased intestinal abundance in rats after MSIB; C: Phylogenetic tree for comparison of linear discriminant analysis (LDA) effect sizes of gut microbiota in MSIB and sham groups, bacteria with significantly enriched LDA scores taxa are marked with the colours shown. Data are expressed as mean ± SEM and statistical significance was determined by two-tailed Student’s test or two-way ANOVA, aP < 0.05, bP < 0.01. MSIB: Mid-small intestine bypass; LDA: Linear discriminant analysis; PCoA: Principal coordinate analysis.
- Citation: Luo X, Tao F, Tan C, Xu CY, Zheng ZH, Pang Q, He XA, Cao JQ, Duan JY. Enhanced glucose homeostasis via Clostridium symbiosum-mediated glucagon-like peptide 1 inhibition of hepatic gluconeogenesis in mid-intestinal bypass surgery. World J Gastroenterol 2023; 29(39): 5471-5482
- URL: https://www.wjgnet.com/1007-9327/full/v29/i39/5471.htm
- DOI: https://dx.doi.org/10.3748/wjg.v29.i39.5471


