Copyright
©The Author(s) 2023.
World J Gastroenterol. Sep 28, 2023; 29(36): 5254-5267
Published online Sep 28, 2023. doi: 10.3748/wjg.v29.i36.5254
Published online Sep 28, 2023. doi: 10.3748/wjg.v29.i36.5254
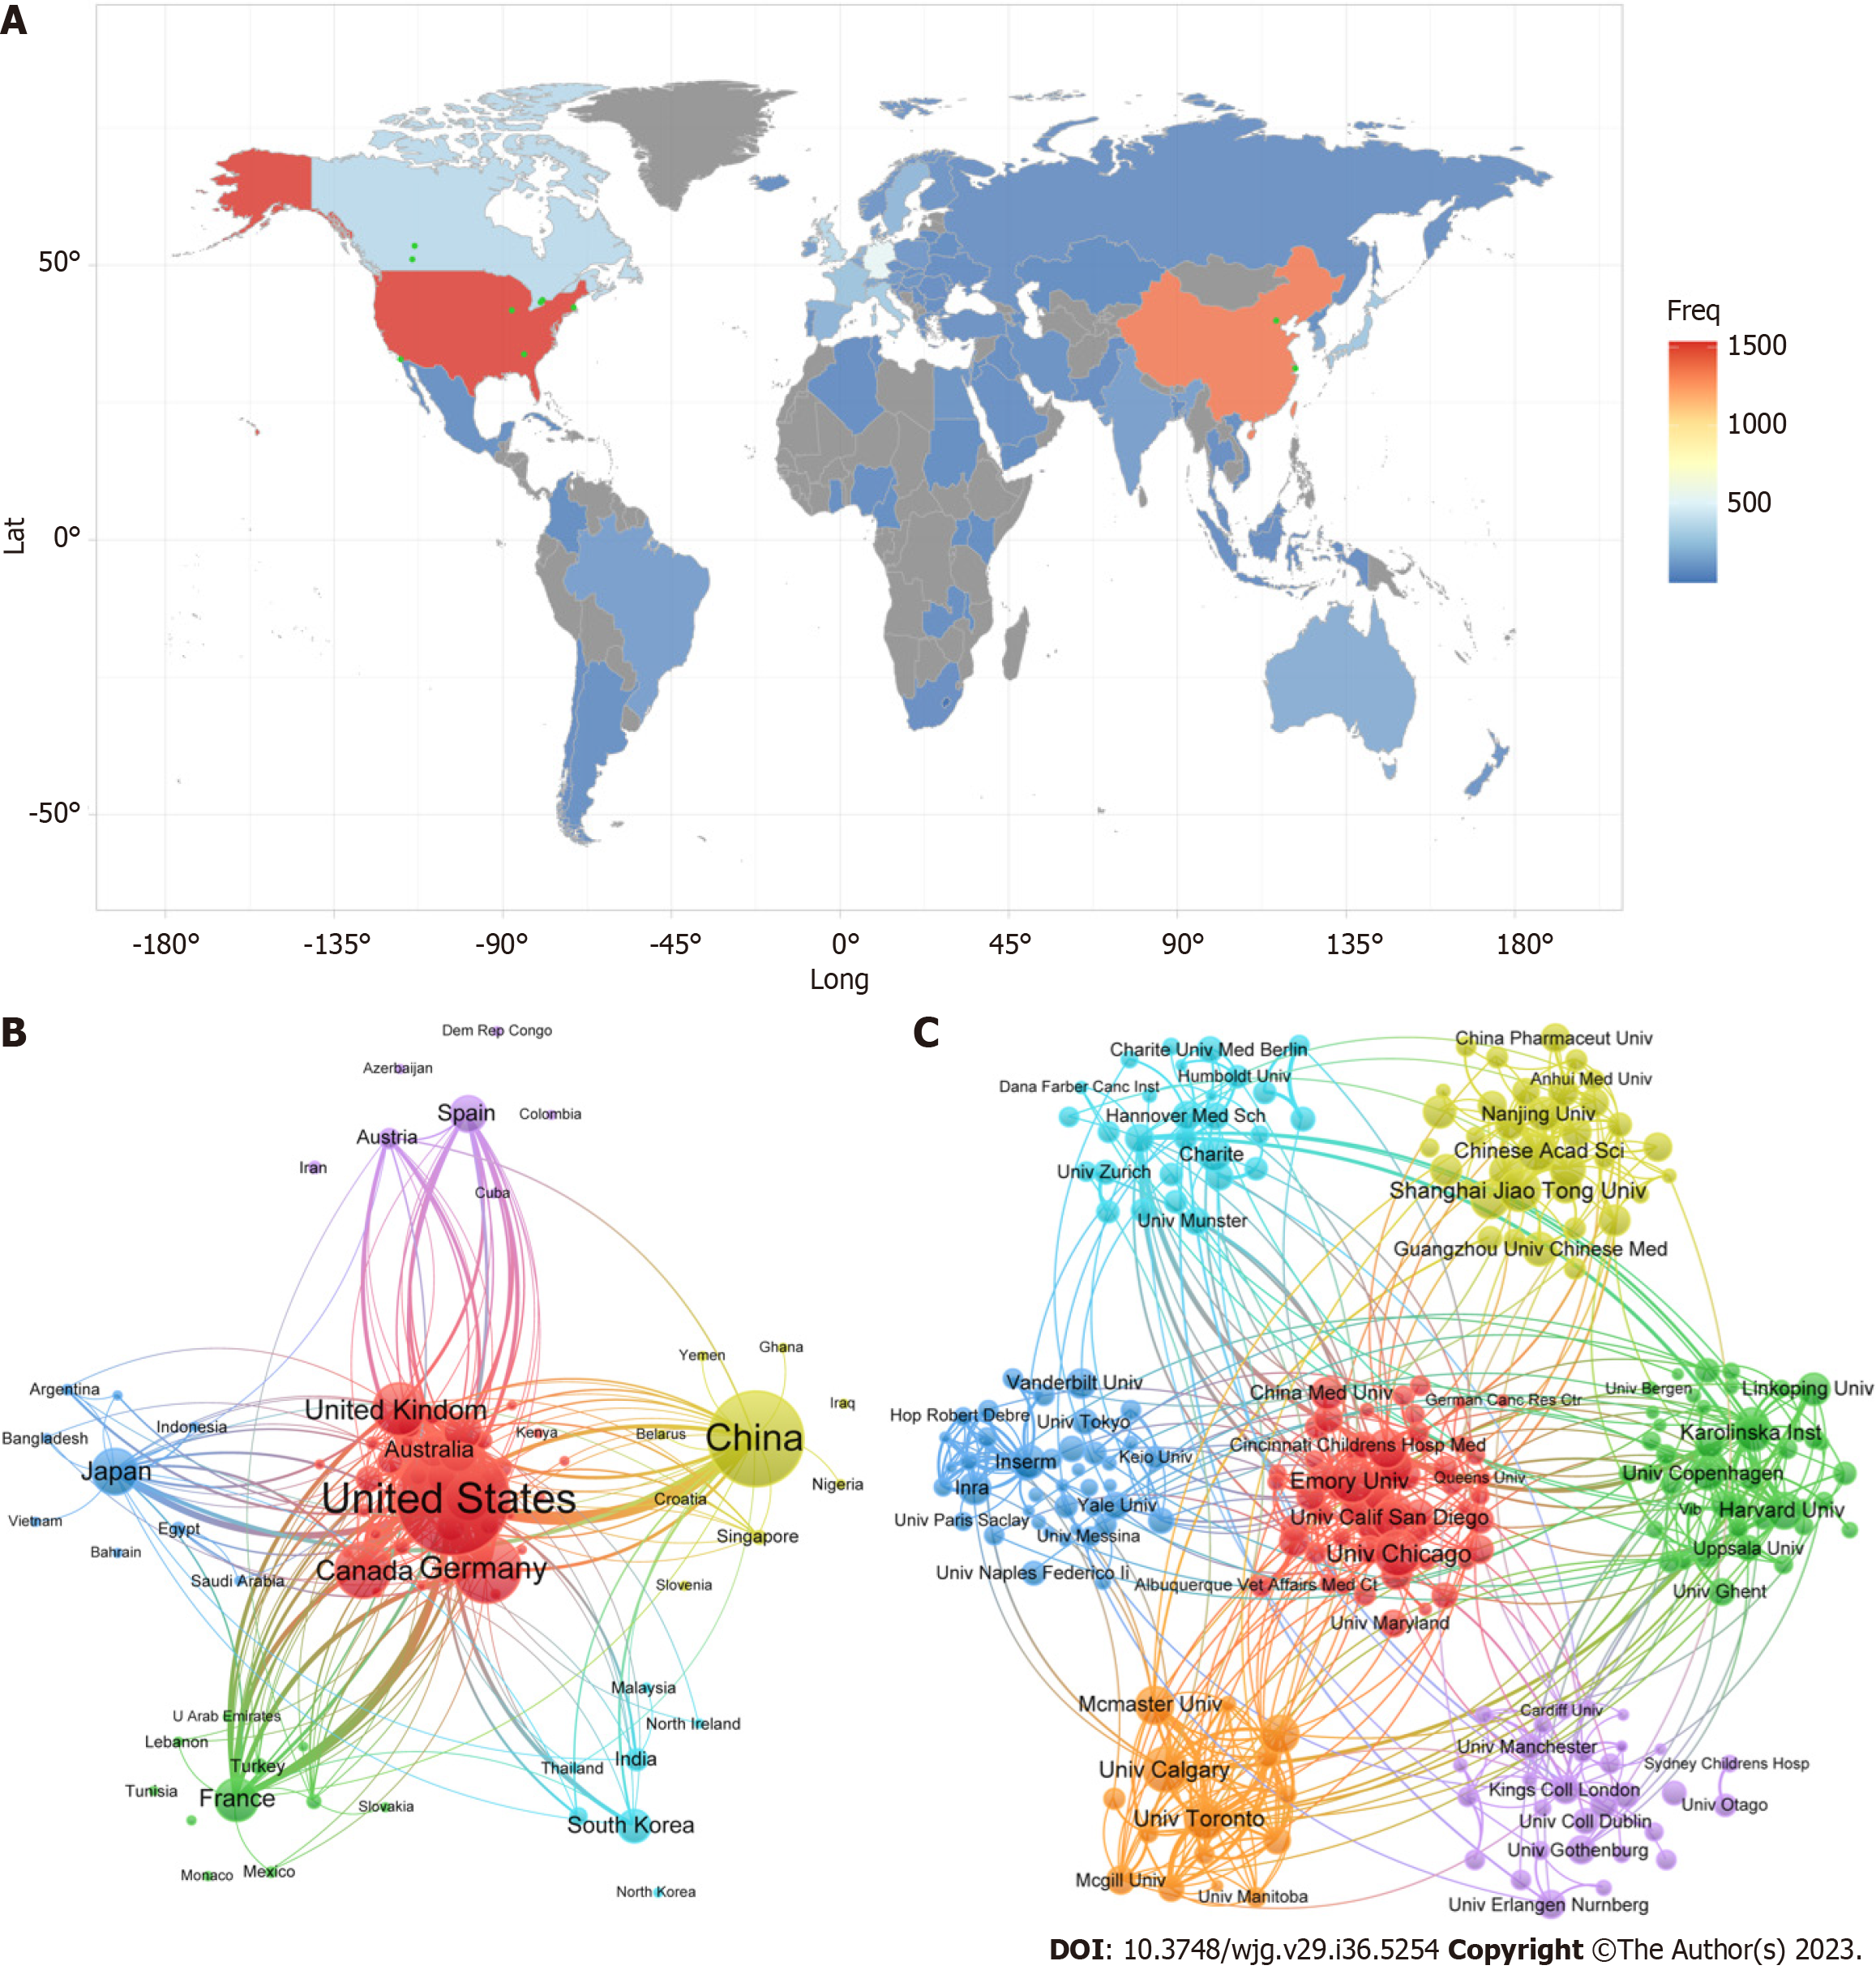
Figure 3 Network visualization map of countries/regions and institutions.
A: Geographic distribution map based on the total publications; B: Cooperation map of countries/regions; C: Cooperation map of institutions. The nodes in the network map represent countries/regions, and the node size is proportional to the number of publications. The thickness of the connecting line between nodes indicates the strength of the co-authorship relationships.
- Citation: Zhou F, Wu NZ, Xie Y, Zhou XJ. Intestinal barrier in inflammatory bowel disease: A bibliometric and knowledge-map analysis. World J Gastroenterol 2023; 29(36): 5254-5267
- URL: https://www.wjgnet.com/1007-9327/full/v29/i36/5254.htm
- DOI: https://dx.doi.org/10.3748/wjg.v29.i36.5254


