Copyright
©The Author(s) 2023.
World J Gastroenterol. Sep 14, 2023; 29(34): 5054-5074
Published online Sep 14, 2023. doi: 10.3748/wjg.v29.i34.5054
Published online Sep 14, 2023. doi: 10.3748/wjg.v29.i34.5054
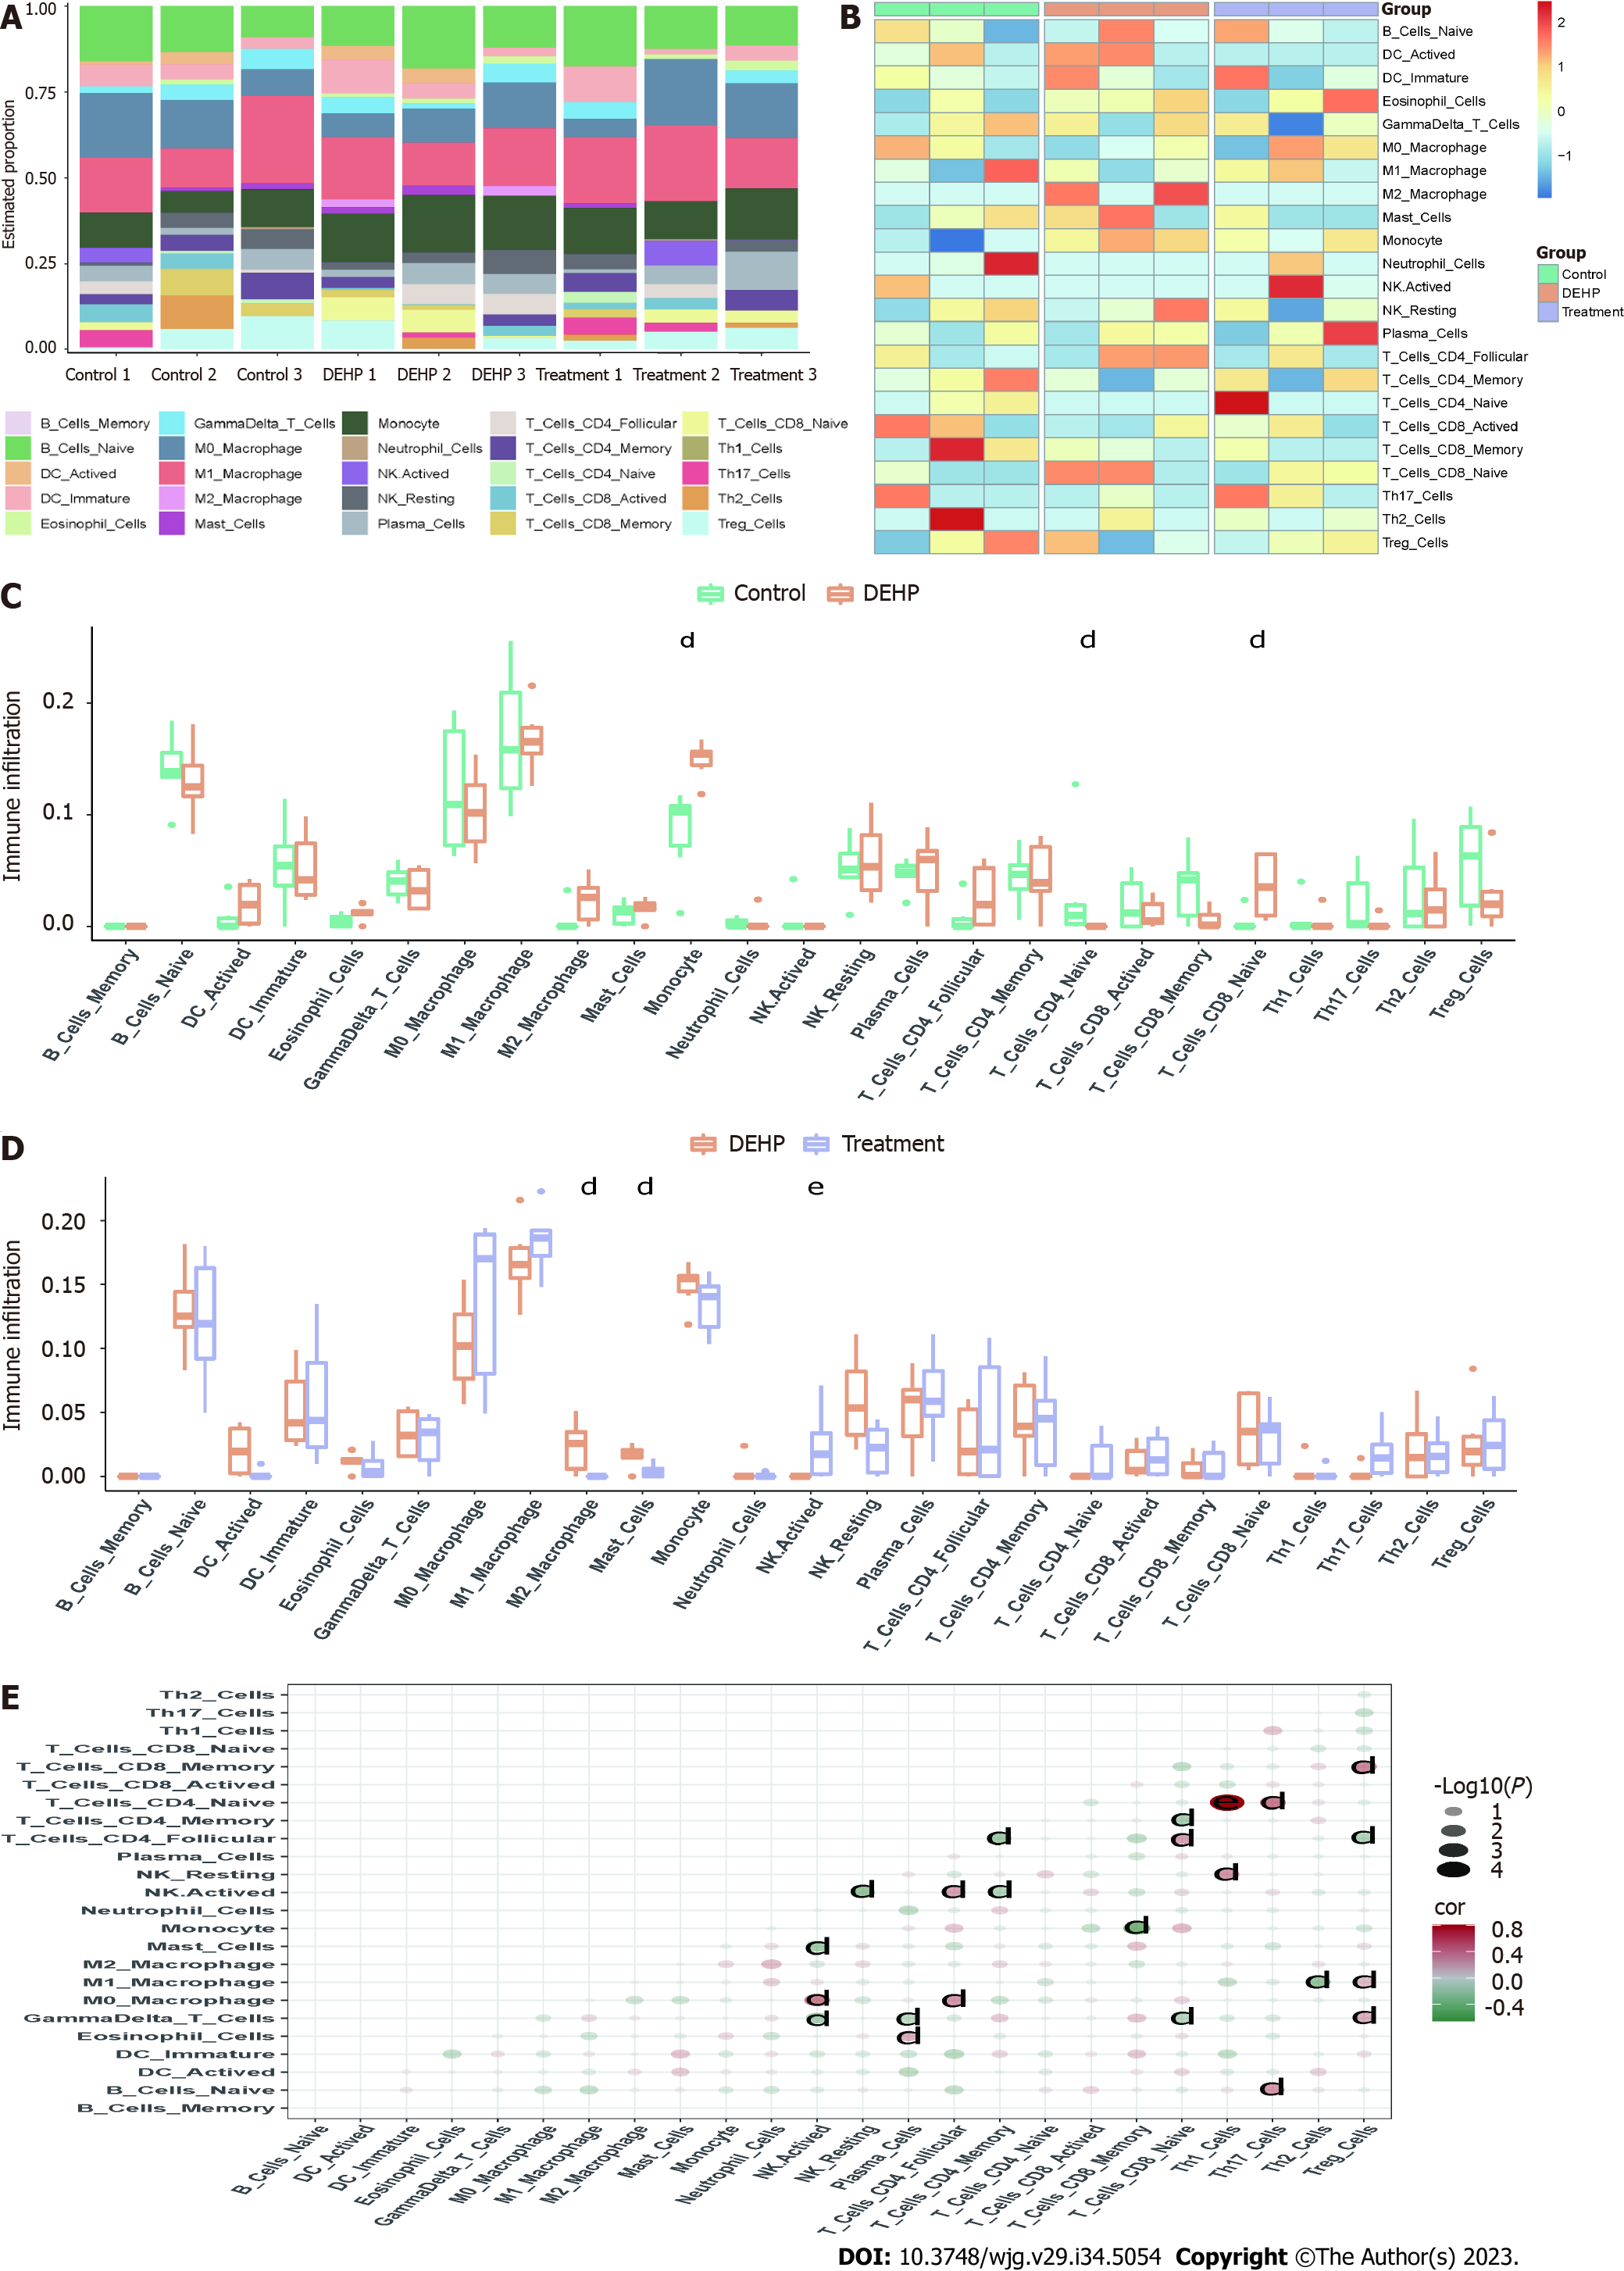
Figure 9 Immune infiltration analyses.
A and B: Histograms (A) and heatmaps (B) of the proportions of immune cells in the control, model, and treatment groups; C and D: Analyses of differential immune cell infiltration between the model and control groups (C), as well as between the treatment and model groups (D); E: Correlation analyses of immune cells in different groups. dP < 0.01 (compared to Di (2-ethylhexyl) phthalate group); eP < 0.05 (compared to Oil group). DEHP: Di (2-ethylhexyl) phthalate.
- Citation: Shi H, Zhao XH, Peng Q, Zhou XL, Liu SS, Sun CC, Cao QY, Zhu SP, Sun SY. Green tea polyphenols alleviate di-(2-ethylhexyl) phthalate-induced liver injury in mice. World J Gastroenterol 2023; 29(34): 5054-5074
- URL: https://www.wjgnet.com/1007-9327/full/v29/i34/5054.htm
- DOI: https://dx.doi.org/10.3748/wjg.v29.i34.5054


