Copyright
©The Author(s) 2023.
World J Gastroenterol. Sep 14, 2023; 29(34): 5054-5074
Published online Sep 14, 2023. doi: 10.3748/wjg.v29.i34.5054
Published online Sep 14, 2023. doi: 10.3748/wjg.v29.i34.5054
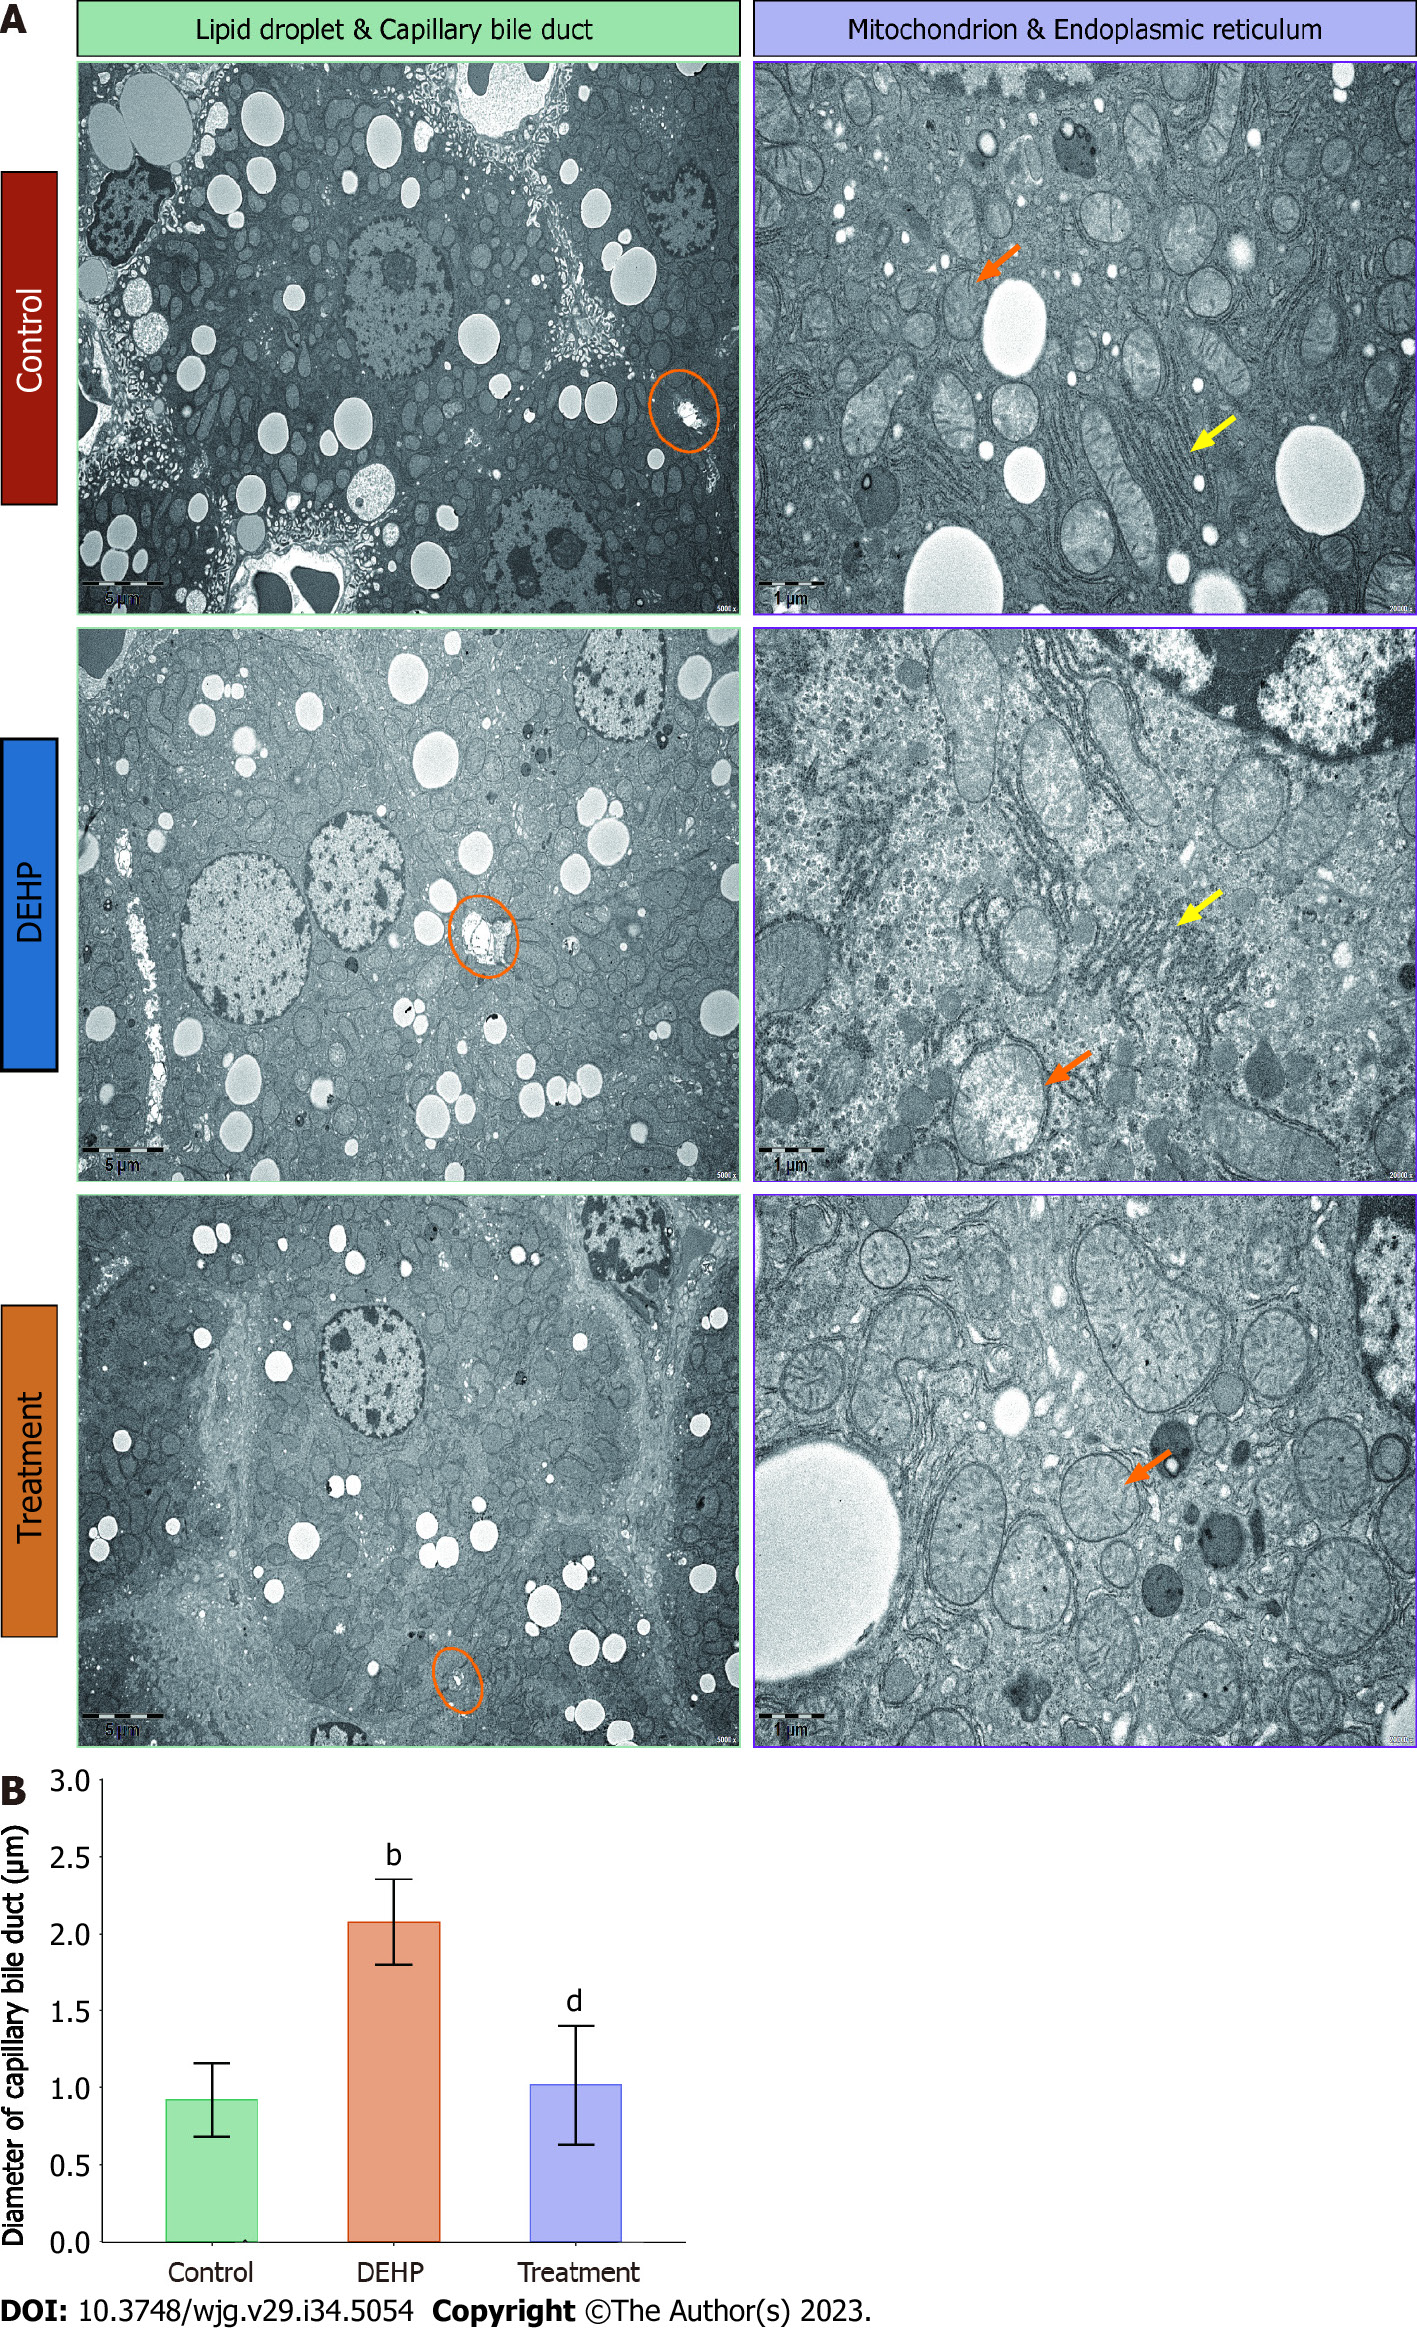
Figure 5 Comparative quantitative analysis of transmission electron microscopy results between the control, model, and treatment groups.
A: Comparison of transmission electron microscopy results between the control, model, and treatment groups. In the model and control groups, increased numbers of fat droplets with enhanced size were visible. Expanded capillary bile ducts (indicated with orange circles), mildly swollen mitochondria (indicated with orange arrows), and disordered rough endoplasmic reticulum (indicated with yellow arrows) were observed in the model group. In the treatment group, the number of fat droplets decreased, capillary bile ducts appeared mostly healthy (indicated with orange circles), and mitochondrial swelling was reduced (indicated with orange arrows); B: Quantitative analysis of small bile duct diameter in mice from the control, model, and treatment groups. bP < 0.01 (compared to the Control group); dP < 0.01 (compared to Di (2-ethylhexyl) phthalate group). DEHP: Di (2-ethylhexyl) phthalate.
- Citation: Shi H, Zhao XH, Peng Q, Zhou XL, Liu SS, Sun CC, Cao QY, Zhu SP, Sun SY. Green tea polyphenols alleviate di-(2-ethylhexyl) phthalate-induced liver injury in mice. World J Gastroenterol 2023; 29(34): 5054-5074
- URL: https://www.wjgnet.com/1007-9327/full/v29/i34/5054.htm
- DOI: https://dx.doi.org/10.3748/wjg.v29.i34.5054


