Copyright
©The Author(s) 2023.
World J Gastroenterol. Jun 28, 2023; 29(24): 3807-3824
Published online Jun 28, 2023. doi: 10.3748/wjg.v29.i24.3807
Published online Jun 28, 2023. doi: 10.3748/wjg.v29.i24.3807
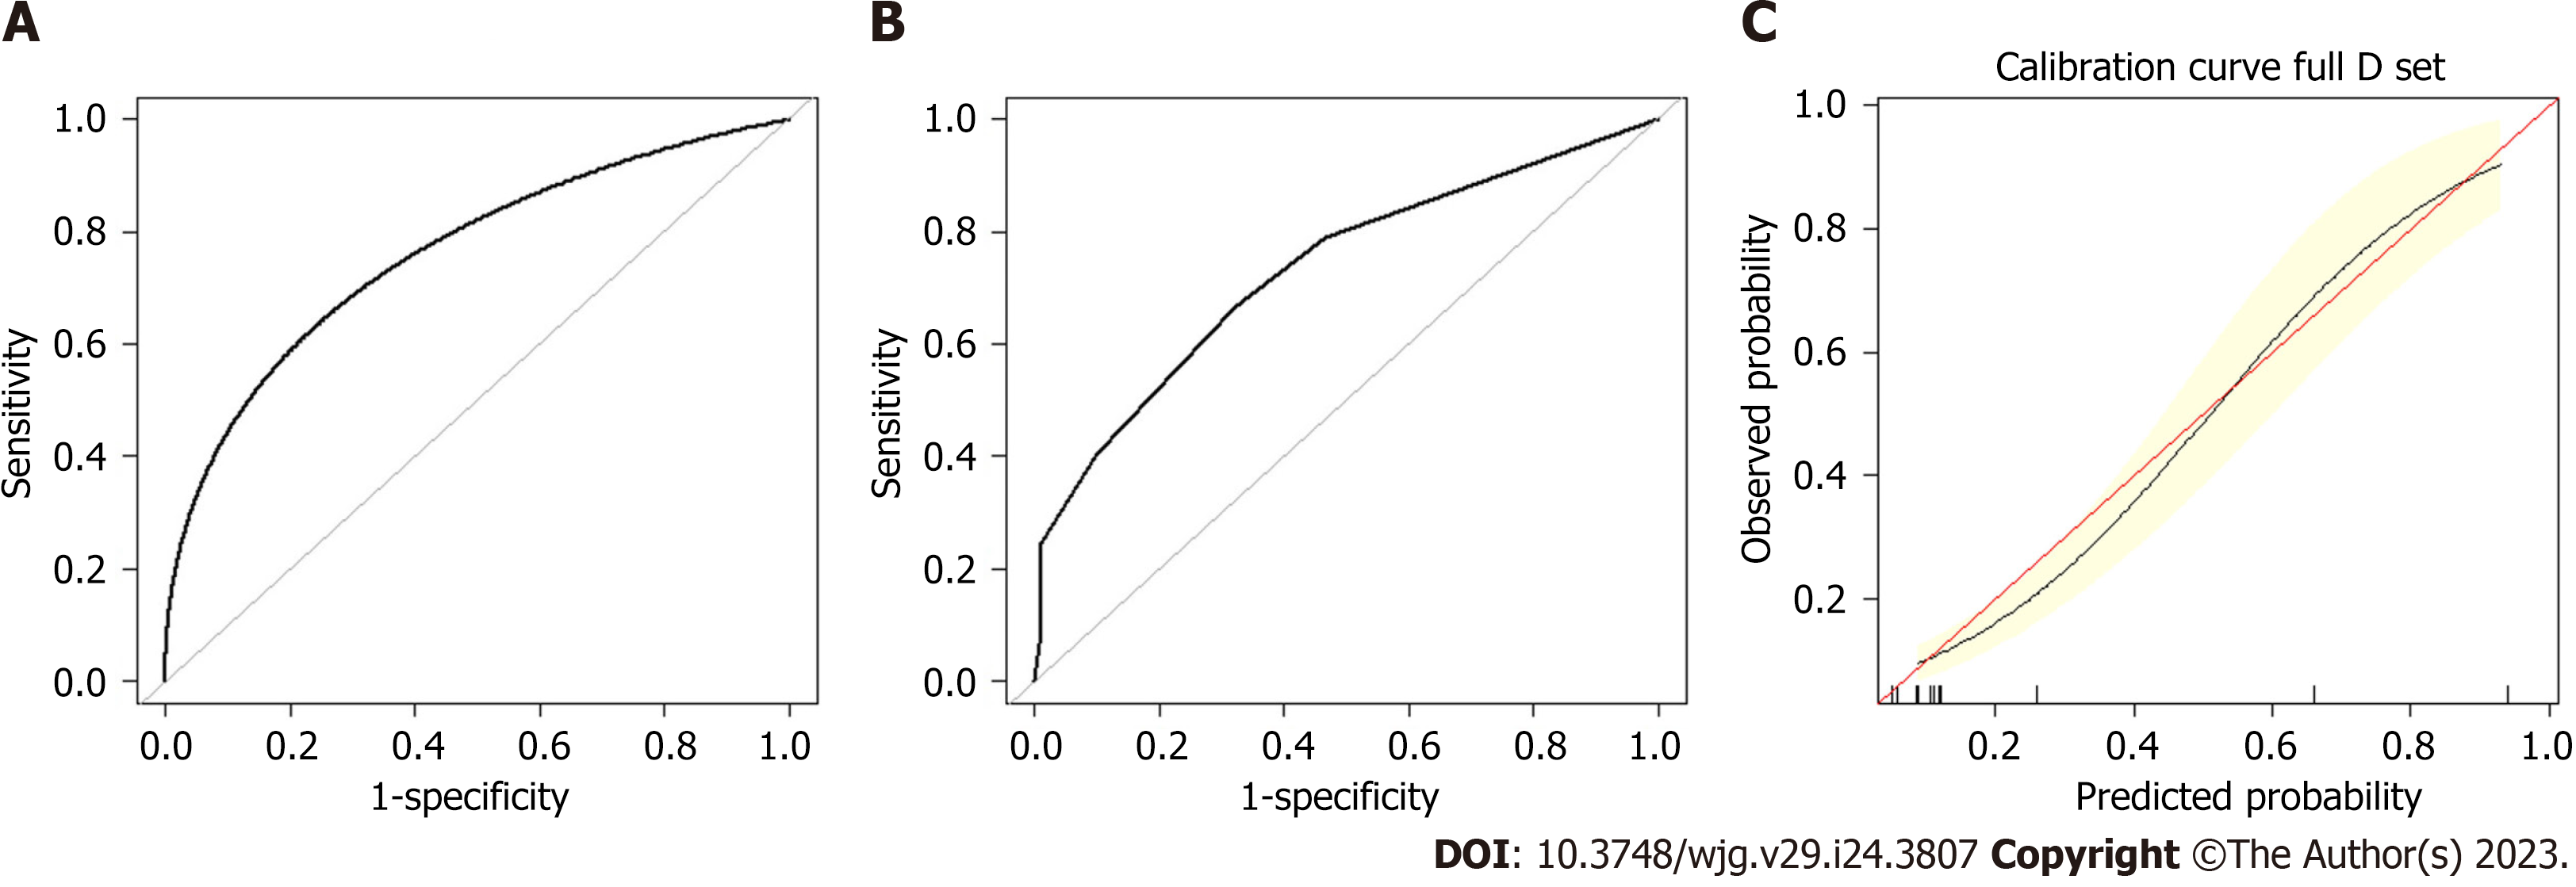
Figure 6 Assessment of the nomogram for predicting lymph node metastasis in the training set and validation set.
A: Receiver-operating characteristic receiver-operating characteristic (ROC) plot in the training set. The area under the curve (AUC) of the ROC was 0.760 (95%CI: 0.682-0.843); B: ROC plot in the validation set. The AUC of the ROC was 0.734 (95%CI: 0.643-0.826); C: Calibration plot in the training set. After 2000 repetitions, the bootstrap-corrected calibration curve (black line) lay close to the ideal reference line (red line), which demonstrated a perfect agreement between the predicted and actual outcomes (mean absolute error 0.012).
- Citation: Yang JJ, Wang XY, Ma R, Chen MH, Zhang GX, Li X. Prediction of lymph node metastasis in early gastric signet-ring cell carcinoma: A real-world retrospective cohort study. World J Gastroenterol 2023; 29(24): 3807-3824
- URL: https://www.wjgnet.com/1007-9327/full/v29/i24/3807.htm
- DOI: https://dx.doi.org/10.3748/wjg.v29.i24.3807


