Copyright
©The Author(s) 2023.
World J Gastroenterol. Jun 28, 2023; 29(24): 3807-3824
Published online Jun 28, 2023. doi: 10.3748/wjg.v29.i24.3807
Published online Jun 28, 2023. doi: 10.3748/wjg.v29.i24.3807
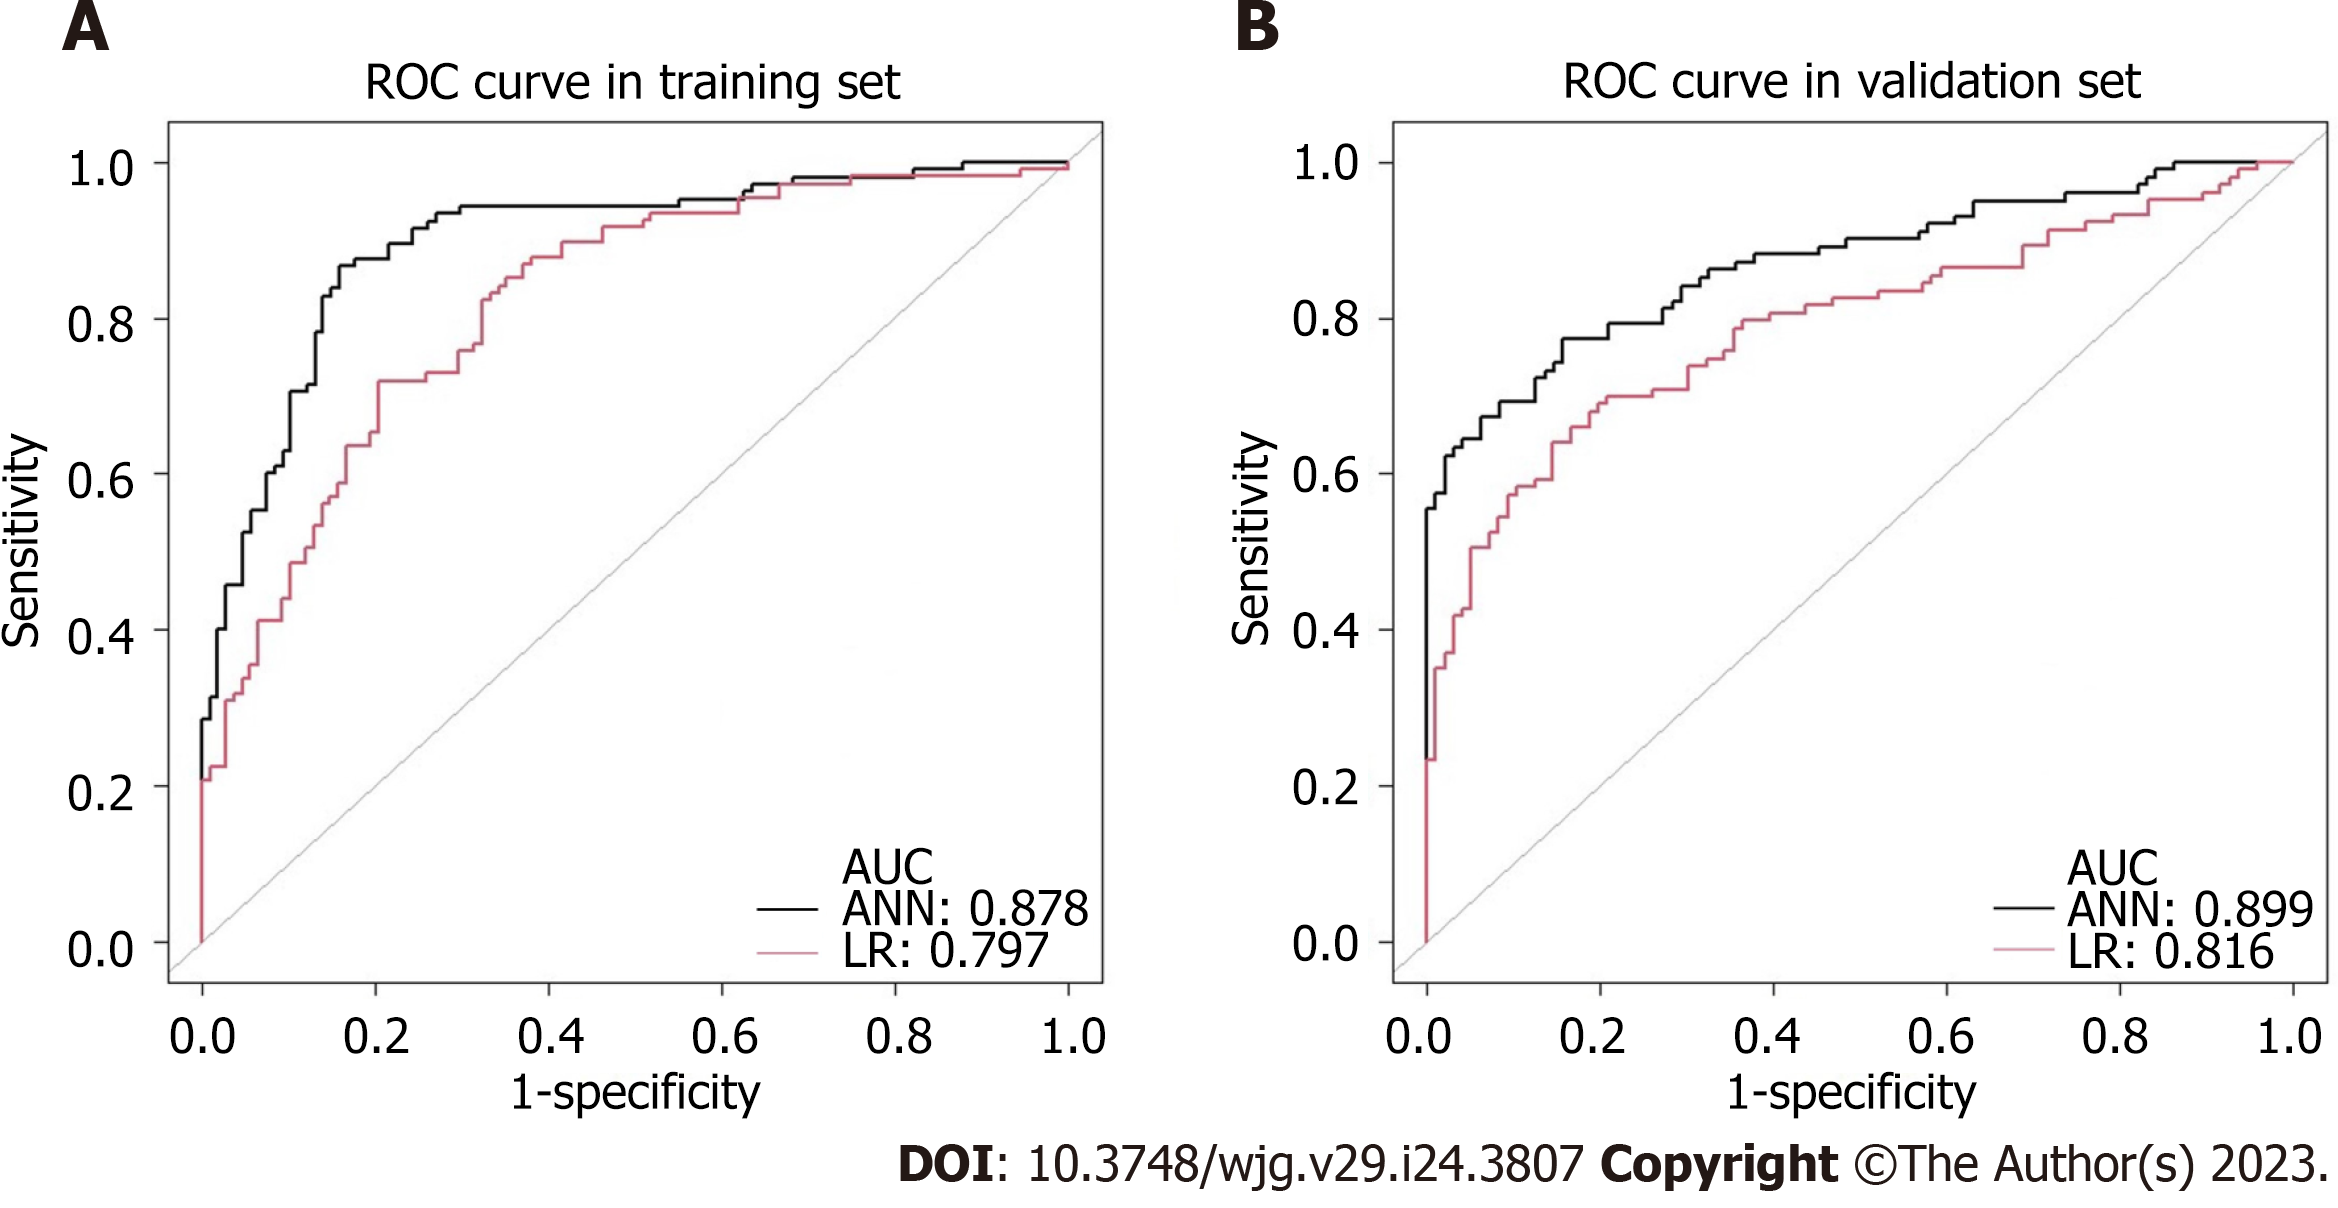
Figure 4 Receiver-operating characteristic curves of the established models for predicting lymph node metastasis in early gastric cancer.
The black and the red curve represent the development data of the artificial neural network and logistic regression model, respectively. A: Comparison of receiver-operating characteristic (ROC) plot in the training set, the area under the curve (AUC) was 0.878 vs 0.797, P < 0.001; B: Comparison of ROC plot in the validation set, the AUC was 0.899 vs 0.816, P < 0.001. ROC: Receiver-operating characteristic; AUC: Area under the curve; ANN: Artificial neural network; LR: Logistic regression.
- Citation: Yang JJ, Wang XY, Ma R, Chen MH, Zhang GX, Li X. Prediction of lymph node metastasis in early gastric signet-ring cell carcinoma: A real-world retrospective cohort study. World J Gastroenterol 2023; 29(24): 3807-3824
- URL: https://www.wjgnet.com/1007-9327/full/v29/i24/3807.htm
- DOI: https://dx.doi.org/10.3748/wjg.v29.i24.3807


