Copyright
©The Author(s) 2023.
World J Gastroenterol. Jun 28, 2023; 29(24): 3793-3806
Published online Jun 28, 2023. doi: 10.3748/wjg.v29.i24.3793
Published online Jun 28, 2023. doi: 10.3748/wjg.v29.i24.3793
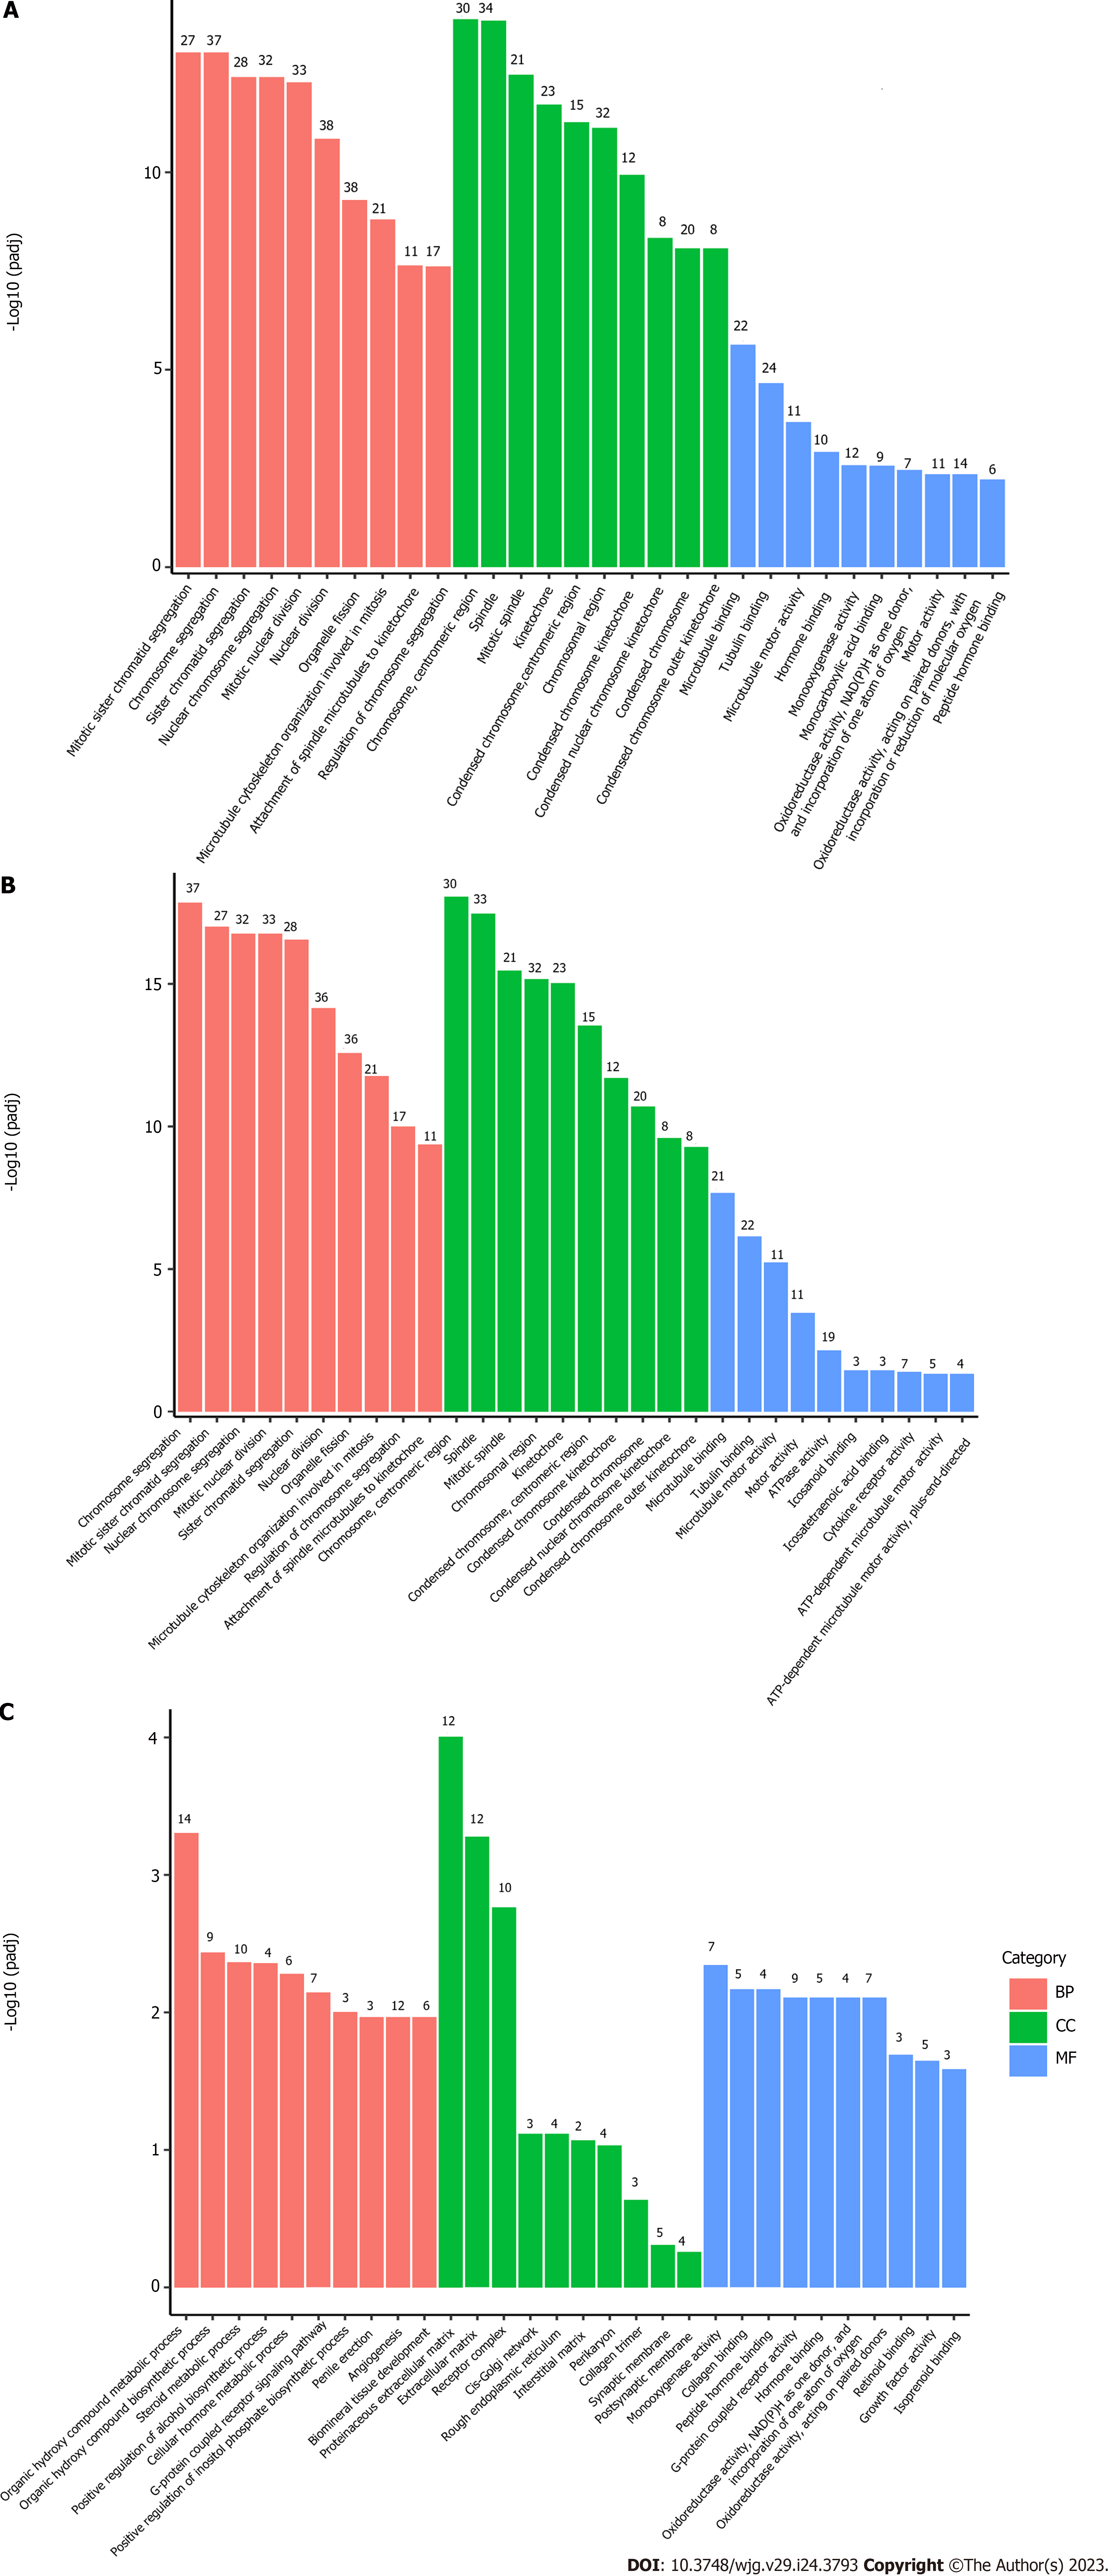
Figure 2 Gene Ontology pathway enrichment analysis of differentially expressed genes.
The bar graph shows the top 10 (red for biological processes, green for cellular component and blue for molecular function) enriched Gene Ontology pathways. A: Gene Ontology (GO) pathway enrichment analysis of all differentially expressed genes (DEGs); B: GO pathway enrichment analysis of upregulated DEGs; C: GO pathway enrichment analysis of downregulated DEGs. BP: Biological process; CC: Cellular component; MF: Molecular function.
- Citation: Liu H, Sun ZY, Jiang H, Li XD, Jiang YQ, Liu P, Huang WH, Lv QY, Zhang XL, Li RK. Transcriptome sequencing and experiments reveal the effect of formyl peptide receptor 2 on liver homeostasis. World J Gastroenterol 2023; 29(24): 3793-3806
- URL: https://www.wjgnet.com/1007-9327/full/v29/i24/3793.htm
- DOI: https://dx.doi.org/10.3748/wjg.v29.i24.3793


