Copyright
©The Author(s) 2023.
World J Gastroenterol. Jun 14, 2023; 29(22): 3469-3481
Published online Jun 14, 2023. doi: 10.3748/wjg.v29.i22.3469
Published online Jun 14, 2023. doi: 10.3748/wjg.v29.i22.3469
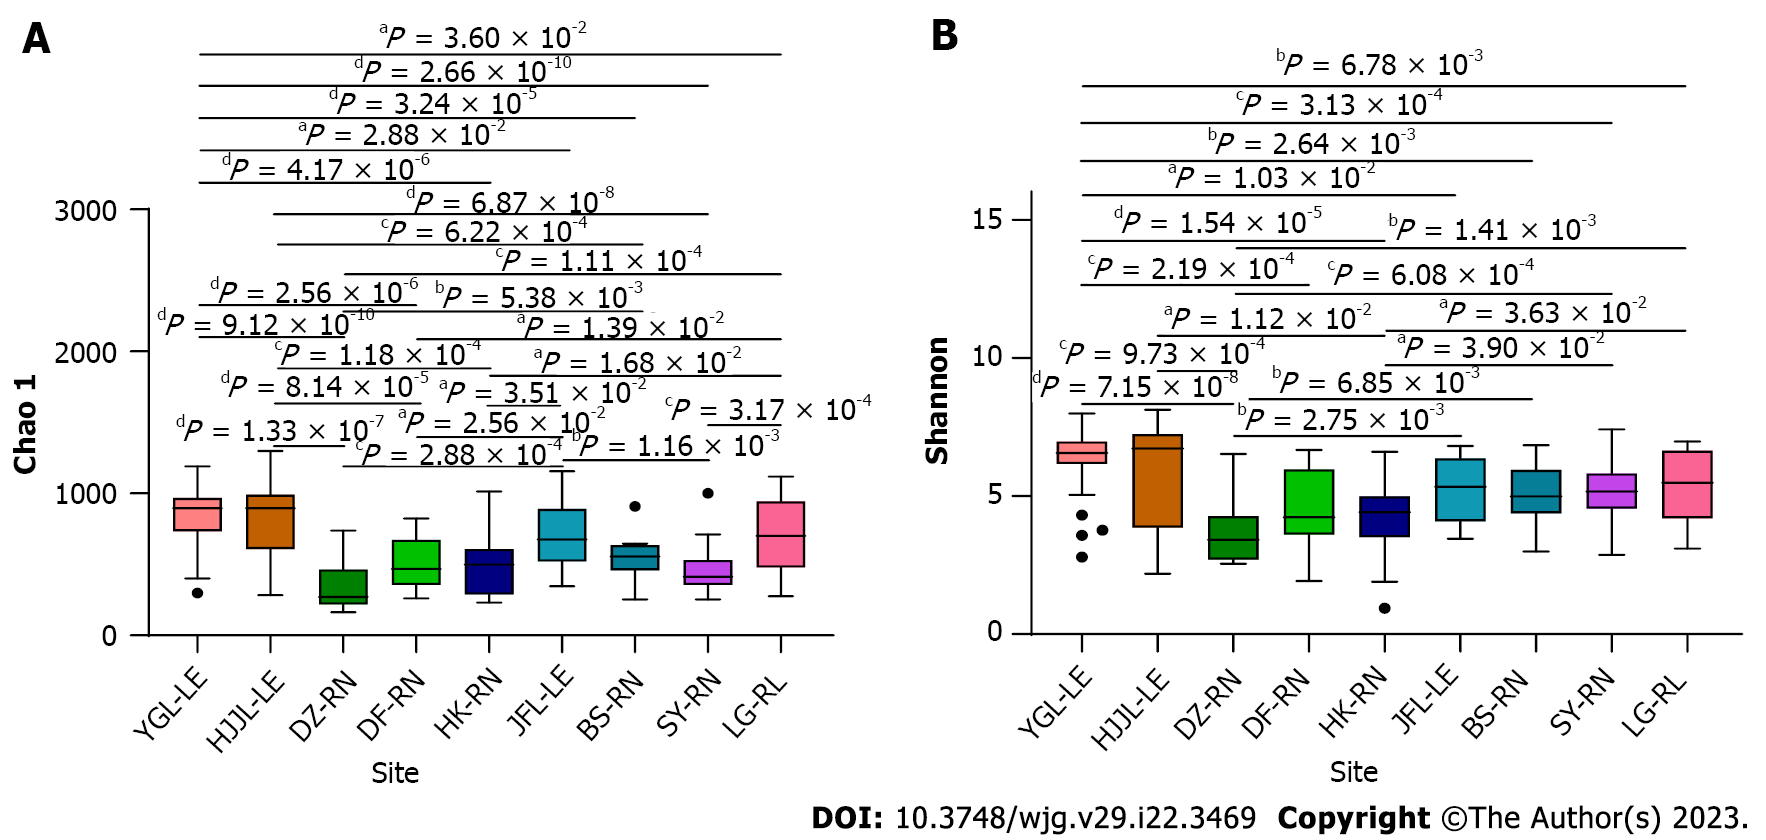
Figure 4 Boxplot representation of observed species.
Boxplots show the distribution of bacteria between rat samples categorized under different locations and rat species. A: Boxplot representation of chao1; B: Boxplot representation of Shannon diversity. Values from all statistical tests are available in additional Table 2. YGL: Yinggeling; HJJL: Huangjingjiaoling; DZ: Danzhou; DF: Dongfang; HK: Haikou; JFL: Jianfengling; BS: Baisha; SY: Sanya; LG: Lingao; LE: Leopoldamys edwardsi; RN: Rattus norvegicus; RL: Rattus losea. aP < 0.05; bP < 0.01; cP < 0.001; dP < 0.0001.
- Citation: Niu LN, Zhang GN, Xuan DD, Lin C, Lu Z, Cao PP, Chen SW, Zhang Y, Cui XJ, Hu SK. Comparative analysis of the gut microbiota of wild adult rats from nine district areas in Hainan, China. World J Gastroenterol 2023; 29(22): 3469-3481
- URL: https://www.wjgnet.com/1007-9327/full/v29/i22/3469.htm
- DOI: https://dx.doi.org/10.3748/wjg.v29.i22.3469


