Copyright
©The Author(s) 2023.
World J Gastroenterol. Jun 14, 2023; 29(22): 3469-3481
Published online Jun 14, 2023. doi: 10.3748/wjg.v29.i22.3469
Published online Jun 14, 2023. doi: 10.3748/wjg.v29.i22.3469
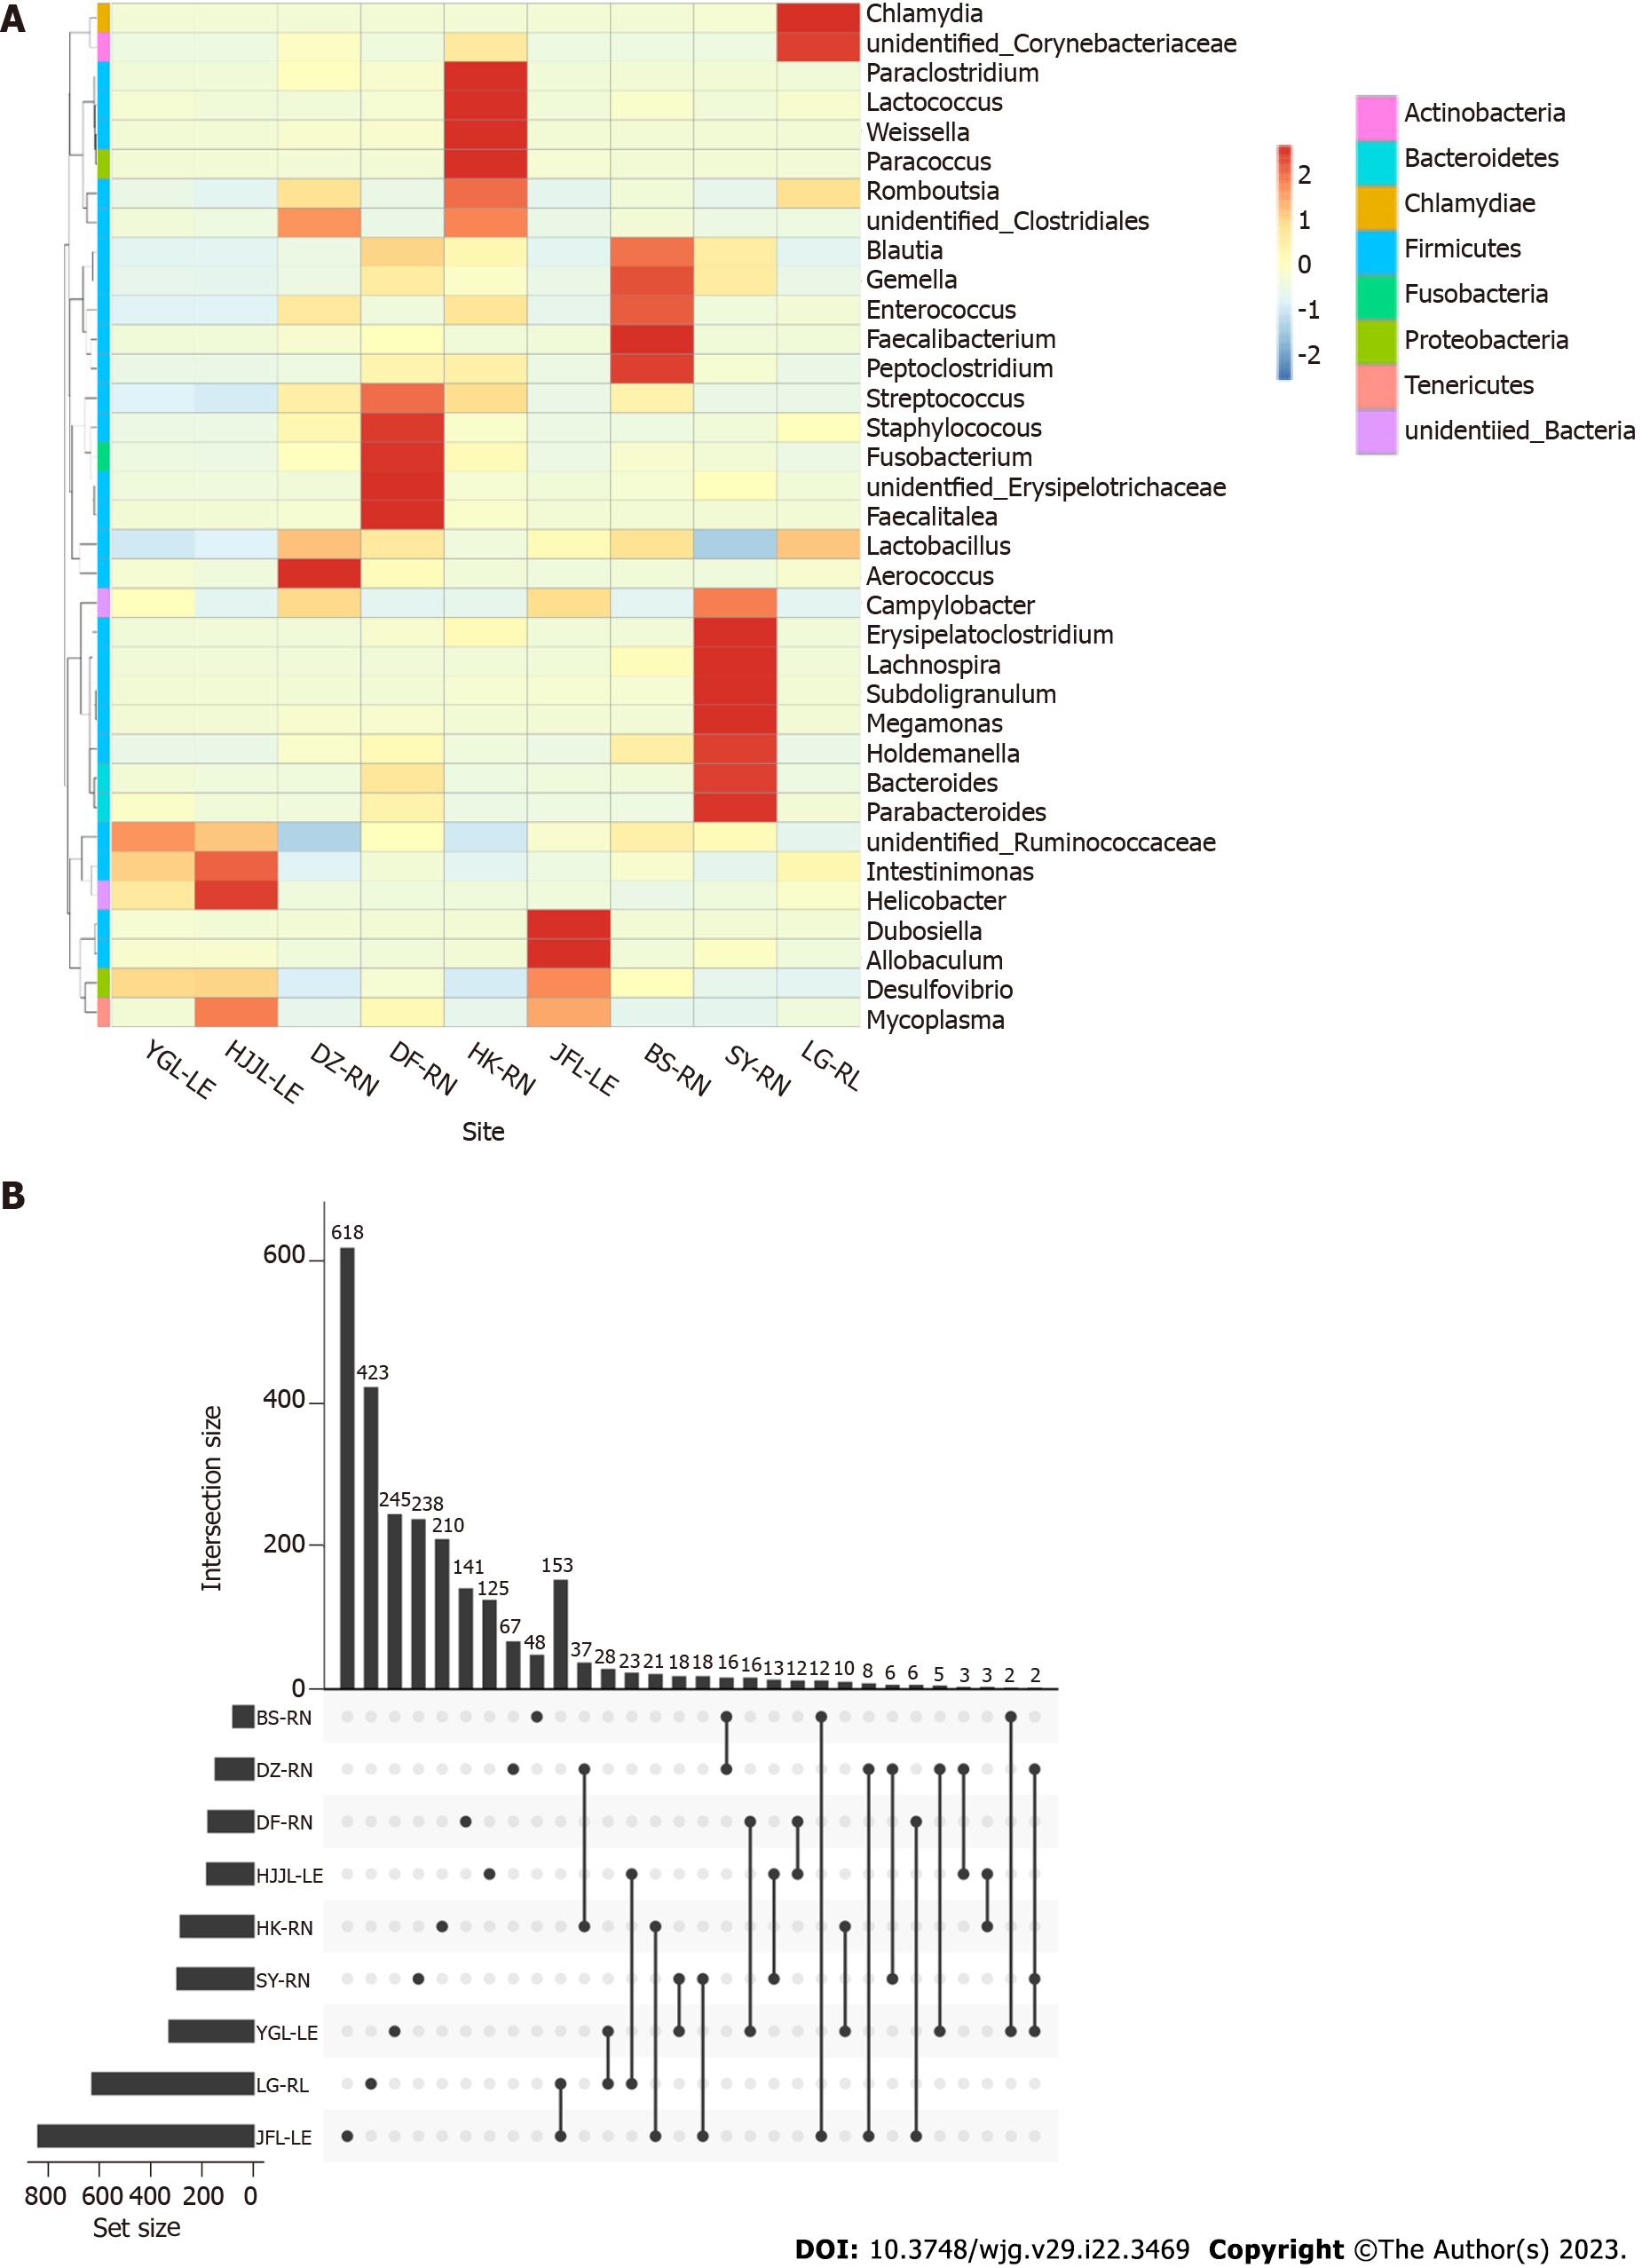
Figure 3 Heatmap and upset plot featuring the rat gut bacterial community.
A: The heatmap in log scale depicting the gut bacterial community of rat feces obtained with open reference operational taxonomic unit (OTU) picking methods. Blue colors represent high abundance, and red colors represent low abundance; white indicates absence; B: Visualizing the relationships between OTUs in all rat species across all sites using an upset plot. The Sangerbox tools, a free online platform for data analysis, were used to create the plot (http://www.sangerbox.com/tool). YGL: Yinggeling; HJJL: Huangjingjiaoling; DZ: Danzhou; DF: Dongfang; HK: Haikou; JFL: Jianfengling; BS: Baisha; SY: Sanya; LG: Lingao; LE: Leopoldamys edwardsi; RN: Rattus norvegicus; RL: Rattus losea.
- Citation: Niu LN, Zhang GN, Xuan DD, Lin C, Lu Z, Cao PP, Chen SW, Zhang Y, Cui XJ, Hu SK. Comparative analysis of the gut microbiota of wild adult rats from nine district areas in Hainan, China. World J Gastroenterol 2023; 29(22): 3469-3481
- URL: https://www.wjgnet.com/1007-9327/full/v29/i22/3469.htm
- DOI: https://dx.doi.org/10.3748/wjg.v29.i22.3469


