Copyright
©The Author(s) 2023.
World J Gastroenterol. May 28, 2023; 29(20): 3145-3156
Published online May 28, 2023. doi: 10.3748/wjg.v29.i20.3145
Published online May 28, 2023. doi: 10.3748/wjg.v29.i20.3145
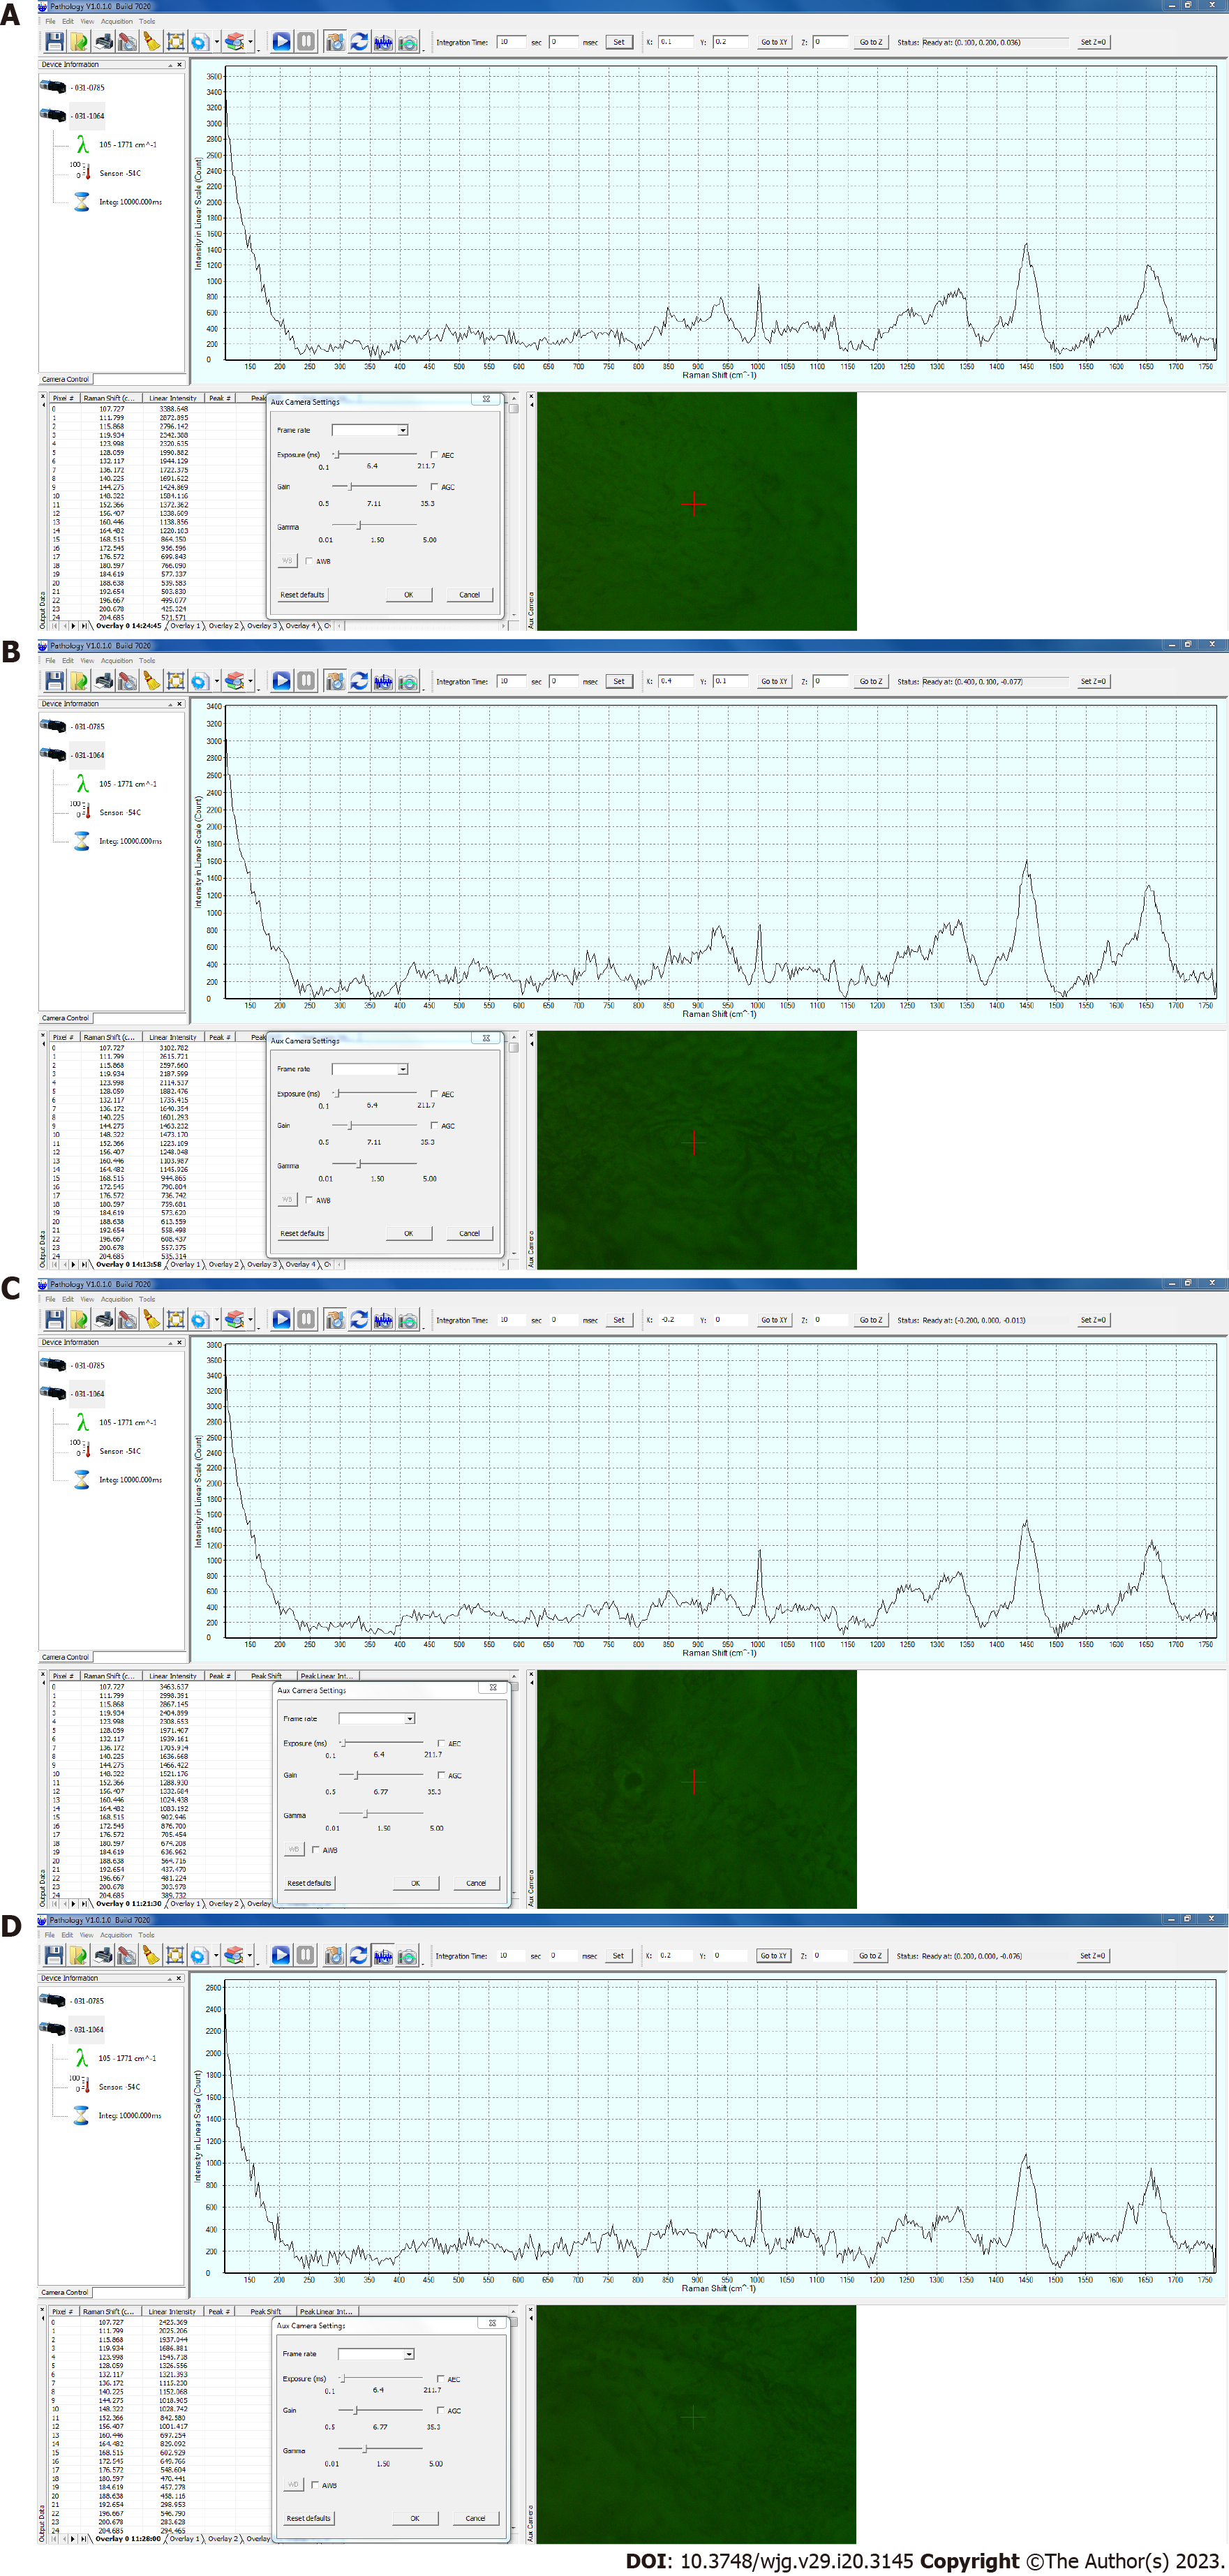
Figure 1 Example of Raman spectra.
Screenshots from the software window illustrating the Raman shift plotted against the intensity on a linear scale. A: Normal esophageal mucosa; B: Esophageal squamous cell carcinoma; C: Normal stomach mucosa; D: Stomach adenocarcinoma.
- Citation: Ito H, Uragami N, Miyazaki T, Shimamura Y, Ikeda H, Nishikawa Y, Onimaru M, Matsuo K, Isozaki M, Yang W, Issha K, Kimura S, Kawamura M, Yokoyama N, Kushima M, Inoue H. Determination of esophageal squamous cell carcinoma and gastric adenocarcinoma on raw tissue using Raman spectroscopy. World J Gastroenterol 2023; 29(20): 3145-3156
- URL: https://www.wjgnet.com/1007-9327/full/v29/i20/3145.htm
- DOI: https://dx.doi.org/10.3748/wjg.v29.i20.3145


