Copyright
©The Author(s) 2023.
World J Gastroenterol. May 28, 2023; 29(20): 3084-3102
Published online May 28, 2023. doi: 10.3748/wjg.v29.i20.3084
Published online May 28, 2023. doi: 10.3748/wjg.v29.i20.3084
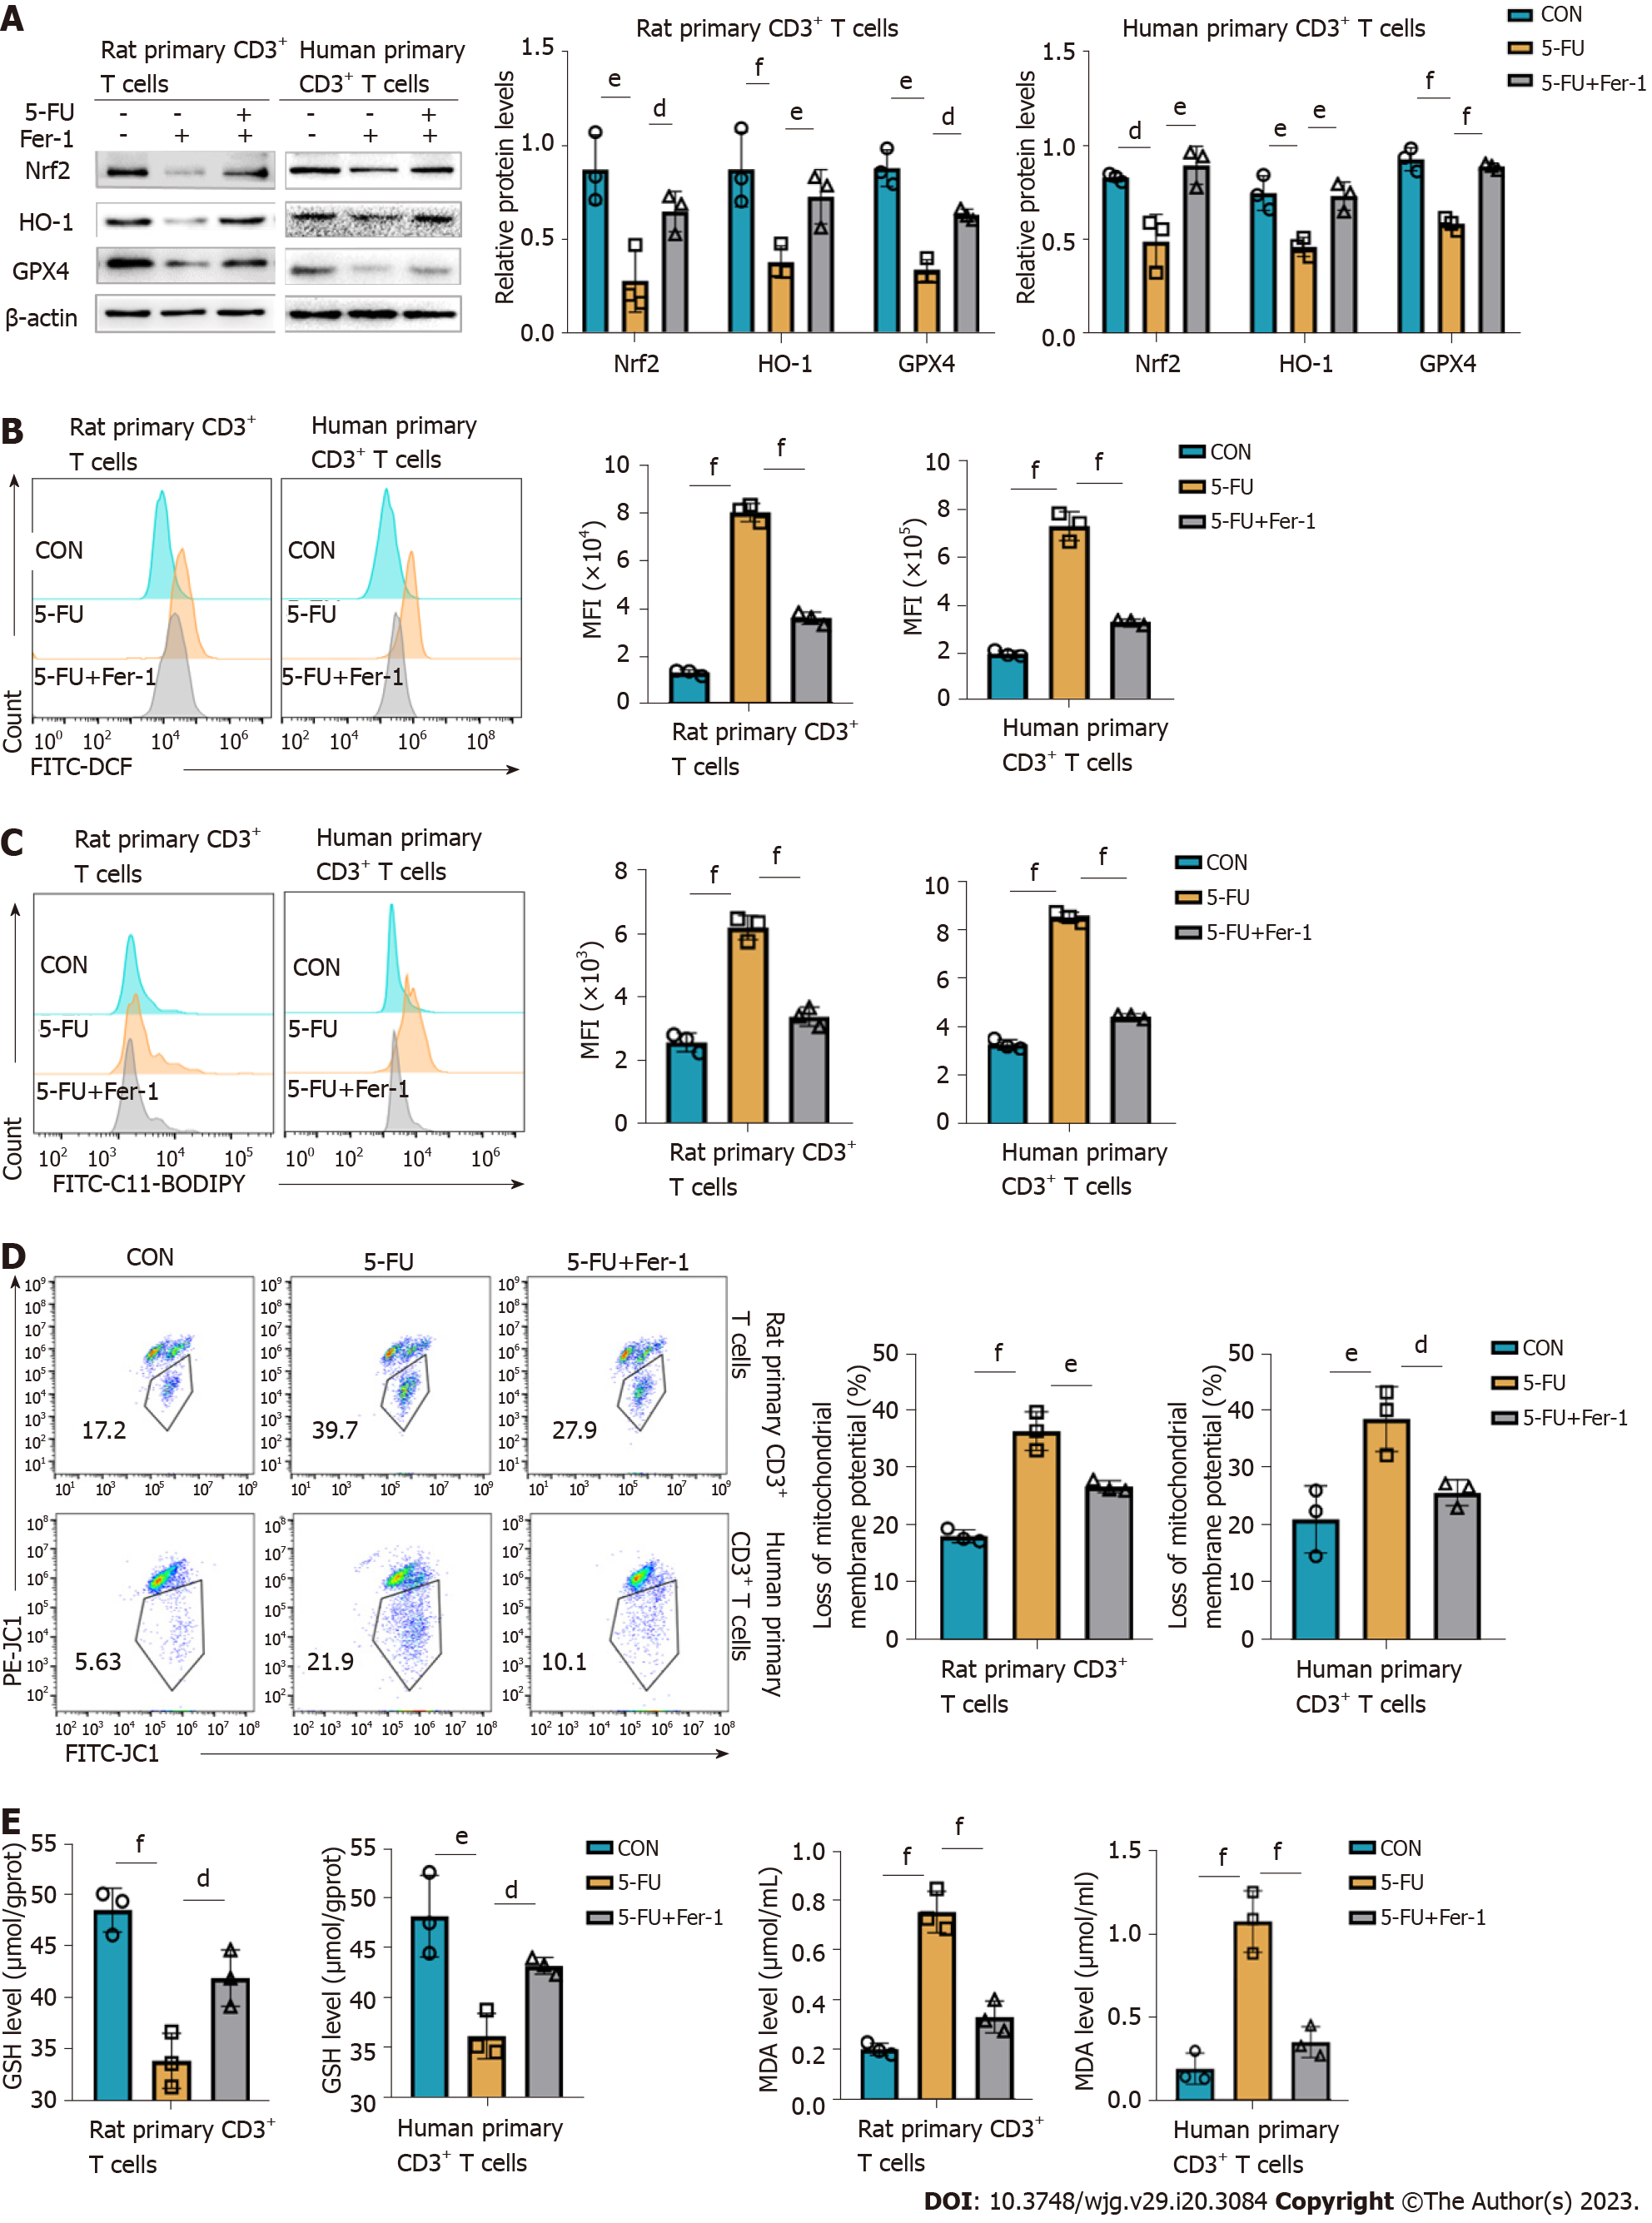
Figure 7 5-fluorouracil disturbs the antioxidative/oxidative balance, resulting in CD3+ T cells ferroptosis.
A: Levels of antioxidant proteins nuclear erythroid 2 p45-related factor 2, heme oxygenase-1, and glutathione peroxidase 4 assessed by western blot, and corresponding graphs showing the statistical comparison between groups; B and C: Reactive oxygen species (ROS) and lipid ROS of rat and human CD3+ T cells were detected by FACS using DCFH-DA and C11-BODIPY fluorescent conjugates, BODIPY emission was recorded on oxidized C11 (FITC channel) signal; the graphs display the comparison of mean fluorescence intensity levels in the different groups; D: Proportion of cells with reduced mitochondrial membrane potential assessed by flow cytometry; E and F: Glutathione and malondialdehyde content T cells after treatment for 48 h. CON groups: T cells were treated with DMSO for 48 h; 5-fluorouracil (5-FU) groups: T cells were treated with 5-FU (15 μmol/L) for 48 h; 5-FU+ferrostatin-1 (Fer-1) groups: T cells were treated with 5-FU (15 μmol/L) and Fer-1 (2 μmol/L) for 48 h. Statistical analysis was done by one-way ANOVA, n = 3. dP < 0.05 vs the 5-FU group, eP < 0.01 vs the 5-FU group, fP < 0.001 vs the 5-FU group. Nrf2: Nuclear erythroid 2 p45-related factor 2; HO-1: Heme oxygenase-1; GPX4: Glutathione peroxidase 4; GSH: Glutathione; MDA: Malondialdehyde; CON: Untreated control groups; 5-FU: 5-fluorouracil; Fer-1: Ferrostatin-1; MFI: Mean fluorescence intensity.
- Citation: Wang H, Wang ZL, Zhang S, Kong DJ, Yang RN, Cao L, Wang JX, Yoshida S, Song ZL, Liu T, Fan SL, Ren JS, Li JH, Shen ZY, Zheng H. Metronomic capecitabine inhibits liver transplant rejection in rats by triggering recipients’ T cell ferroptosis. World J Gastroenterol 2023; 29(20): 3084-3102
- URL: https://www.wjgnet.com/1007-9327/full/v29/i20/3084.htm
- DOI: https://dx.doi.org/10.3748/wjg.v29.i20.3084


