Copyright
©The Author(s) 2023.
World J Gastroenterol. May 28, 2023; 29(20): 3084-3102
Published online May 28, 2023. doi: 10.3748/wjg.v29.i20.3084
Published online May 28, 2023. doi: 10.3748/wjg.v29.i20.3084
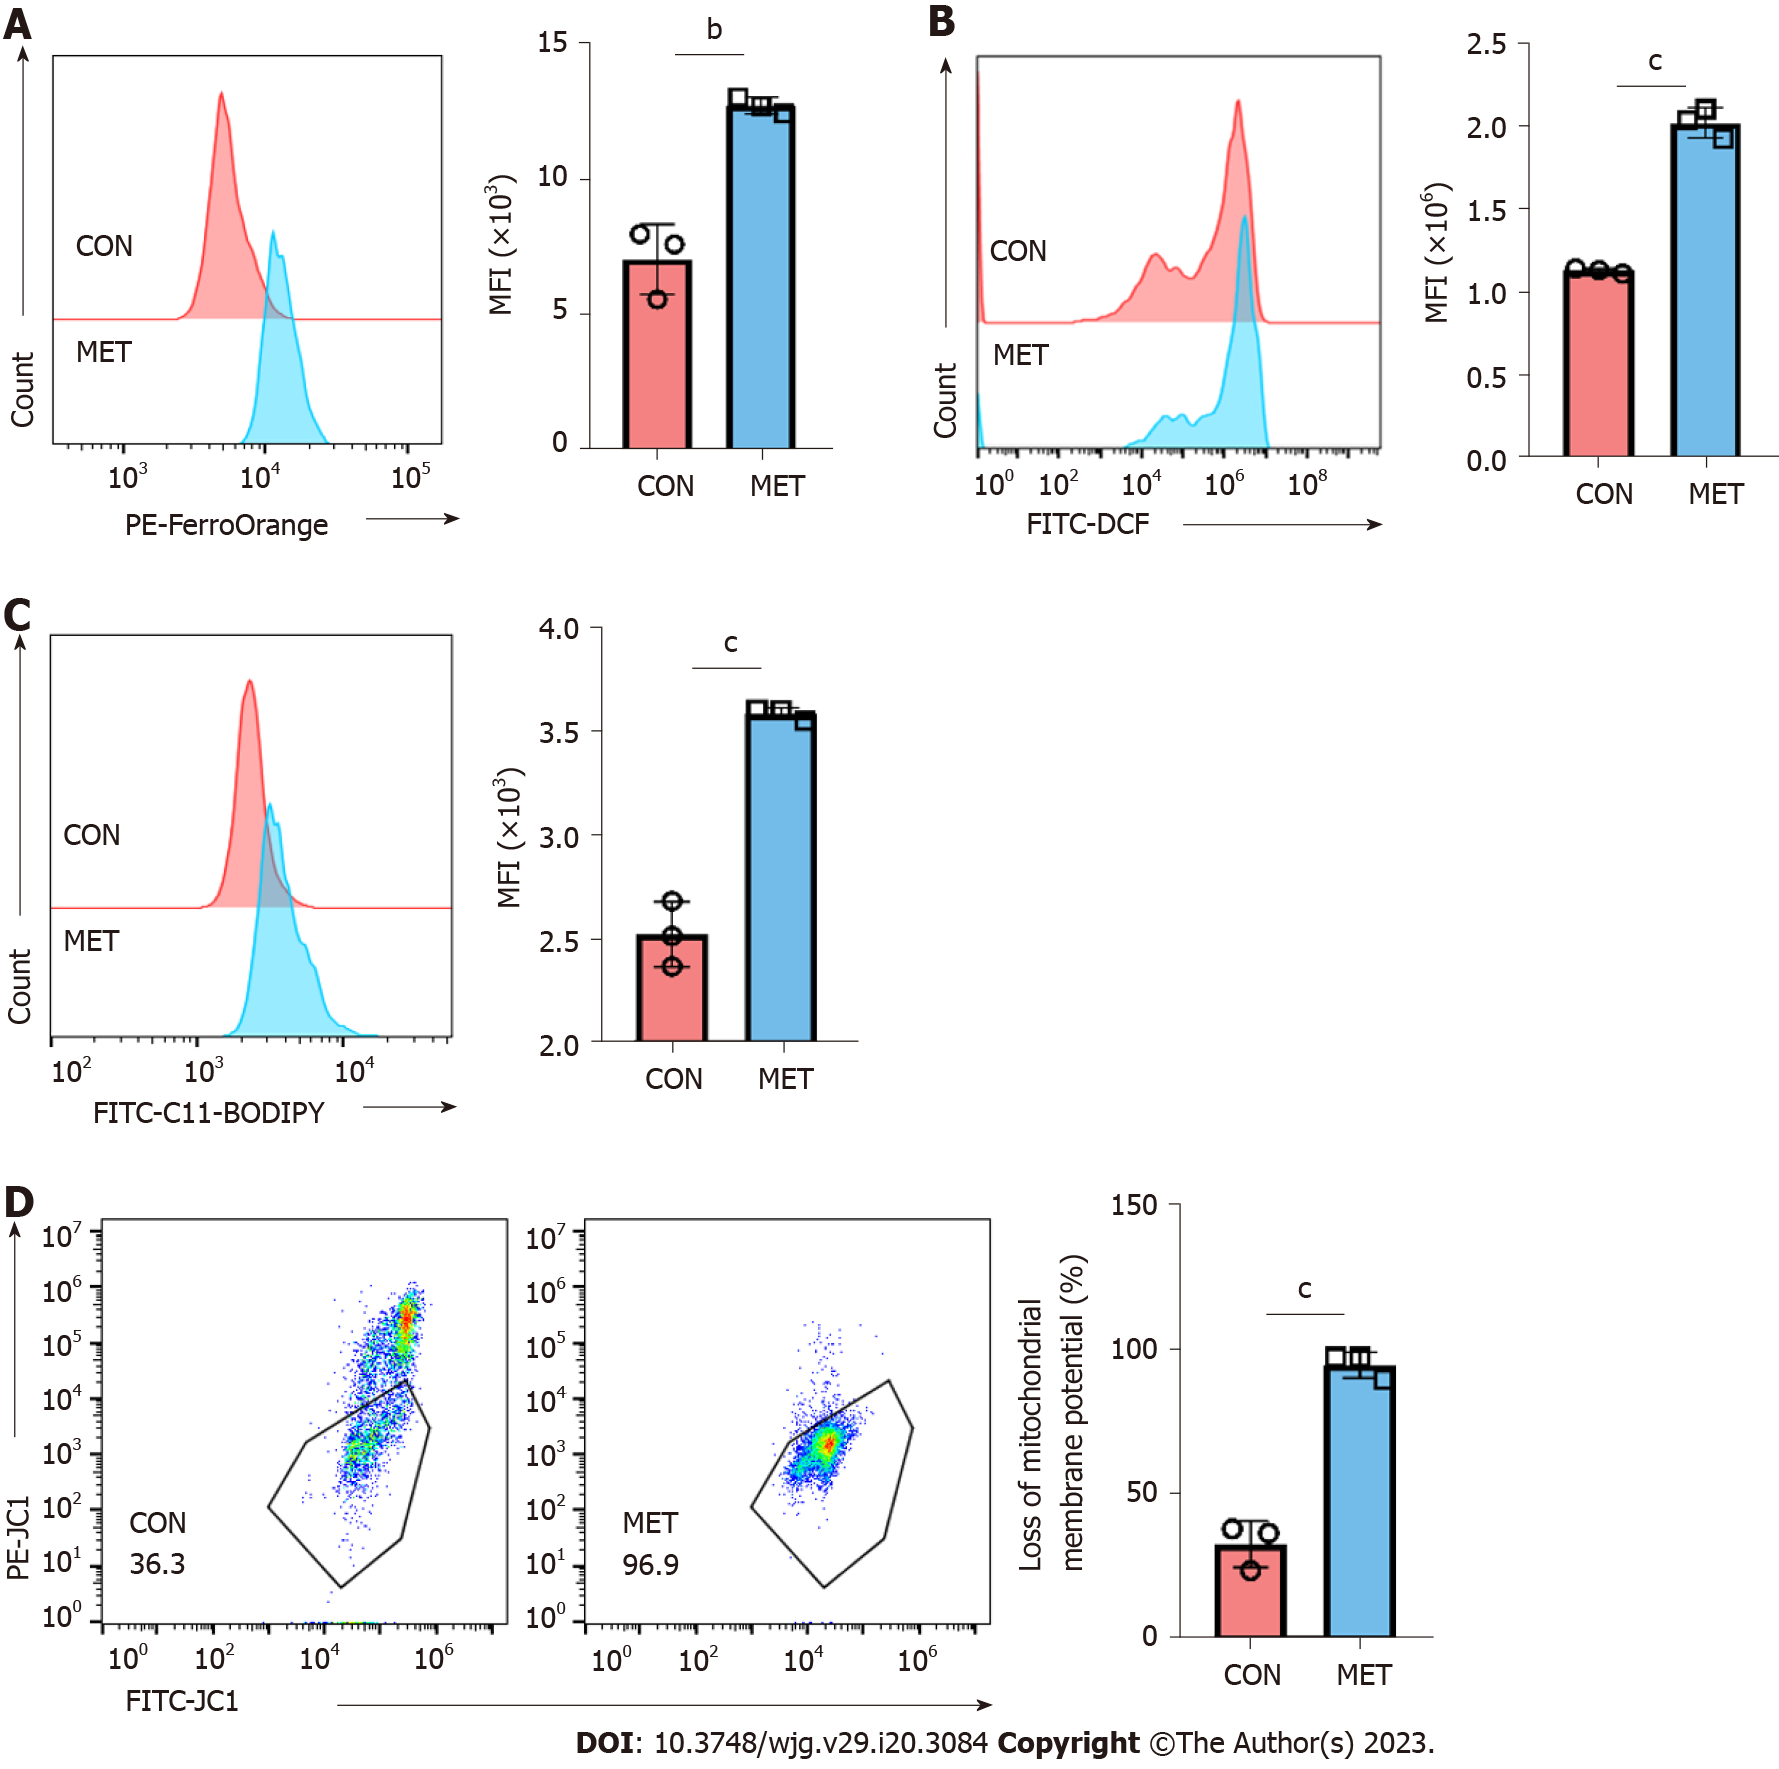
Figure 5 Metronomic capecitabine caused the increase of free ferrous ions and oxidative stress in peripheral blood CD3+ T cells of transplanted rats.
A: Representative FACS data showing differential FerroOrange staining reflecting different cytoplasmic labile iron concentrations in control groups and metronomic capecitabine-treated rats, followed by statistical analysis of mean fluorescence intensity (MFI); B and C: Reactive oxygen species (ROS) and lipid ROS detected by FACS using DCFH-DA and C11-BODIPY respectively, BODIPY emission was recorded on oxidized C11 (FITC channel) signal. The graph shows the statistical analysis of differential MFIs in the two groups; D: The proportion of cells with reduced mitochondrial membrane potential was assessed by flow cytometry. Statistical analysis was done by unpaired t-test, n = 3. Data are shown as mean ± SD; bP < 0.01 vs the control group, cP < 0.001 vs the control group. CON: Untreated control groups, rats received 0.9% normal saline for 7 d; MET: Metronomic capecitabine (CAP)-treated groups, rats received metronomic CAP (100 mg/kg/d) treated for 7 d; MFI: Mean fluorescence intensity.
- Citation: Wang H, Wang ZL, Zhang S, Kong DJ, Yang RN, Cao L, Wang JX, Yoshida S, Song ZL, Liu T, Fan SL, Ren JS, Li JH, Shen ZY, Zheng H. Metronomic capecitabine inhibits liver transplant rejection in rats by triggering recipients’ T cell ferroptosis. World J Gastroenterol 2023; 29(20): 3084-3102
- URL: https://www.wjgnet.com/1007-9327/full/v29/i20/3084.htm
- DOI: https://dx.doi.org/10.3748/wjg.v29.i20.3084


