Copyright
©The Author(s) 2023.
World J Gastroenterol. May 14, 2023; 29(18): 2798-2817
Published online May 14, 2023. doi: 10.3748/wjg.v29.i18.2798
Published online May 14, 2023. doi: 10.3748/wjg.v29.i18.2798
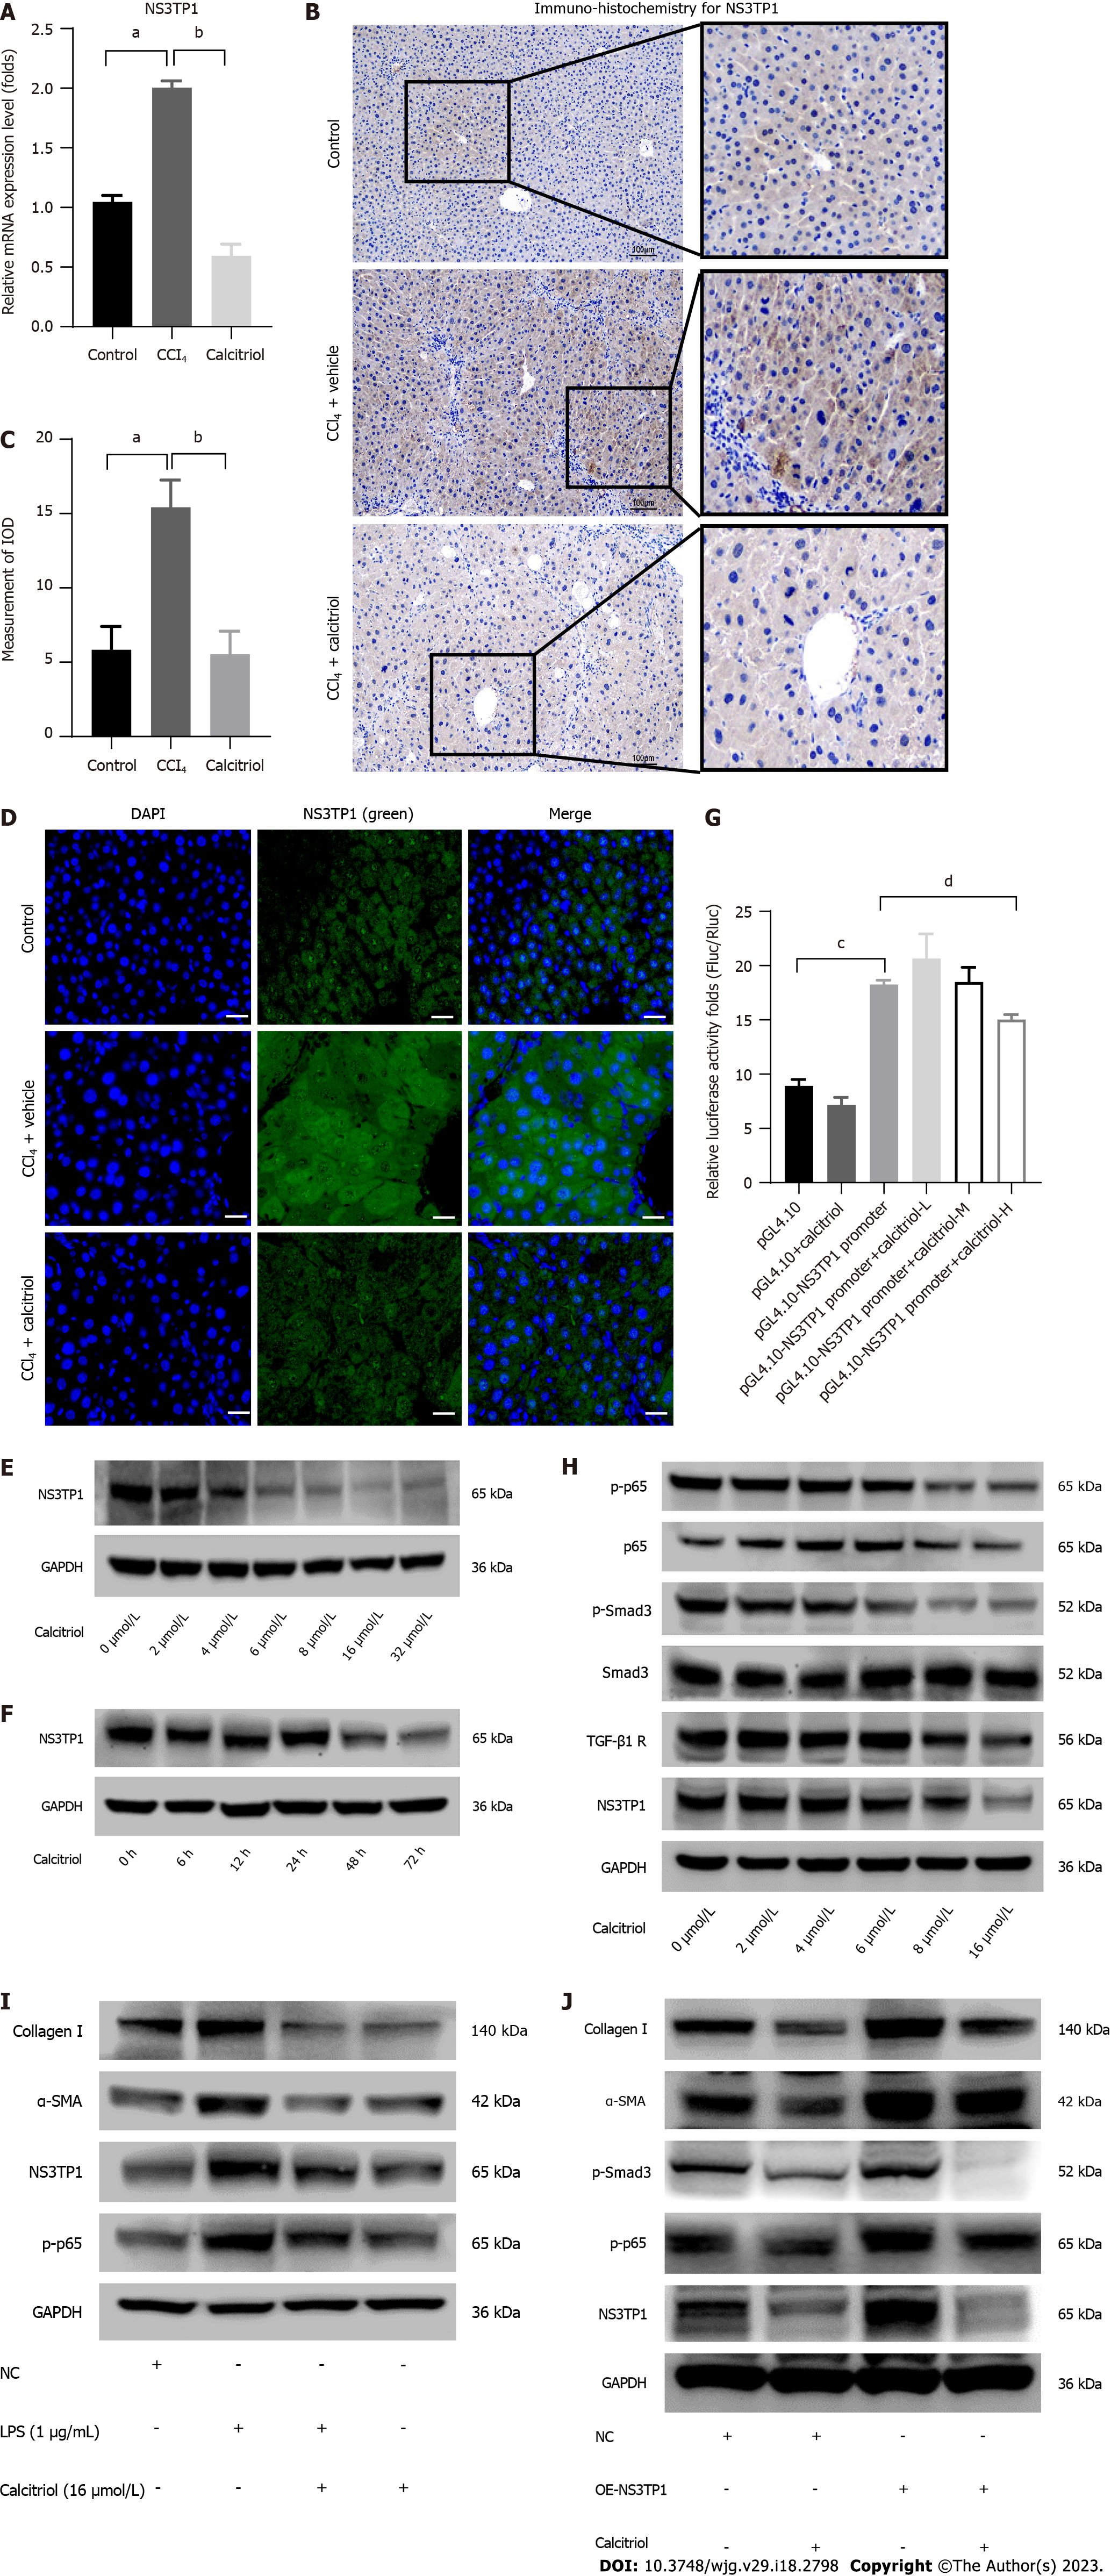
Figure 5 The relationship between calcitriol and nonstructural protein 3-transactivated protein 1.
A: RT-qPCR analysis of nonstructural protein 3-transactivated protein 1 (NS3TP1) in mice treated with calcitriol (n = 6); B: Immunohistochemical staining for α-smooth muscle actin (α-SMA) in hepatic tissue, scale bar = 100 μm; C: Image J analysis of immunohistochemical staining for α-SMA, (n = 3); D: Immunofluorescence staining for NS3TP1 in liver tissue, green: NS3TP1 (n = 3), scale bar = 20 μm; E and F: Western blot analysis of NS3TP1 in LX-2 cells stimulated with various concentrations of calcitriol or with 16 μmol/L calcitriol for various durations (n = 3); G: Analysis of luciferase activity between the NS3TP1 promoter and calcitriol in HepG2 cells, calcitriol (L: 8 μmol/L, M: 16 μmol/L, H: 32 μmol/L); H: Western blot analysis of the activity of both above signaling pathways in LX-2 cells treated with different concentrations of calcitriol; I: Collagen I, α-SMA, NS3TP1, and p-p65 in calcitriol-treated LX-2 cells were measured by Western blot and compared to LPS-treated cells; J: Extracellular matrix accumulation was evaluated by Western blot in LX-2 cells stimulated with calcitriol after NS3TP1 overexpression. The data was represented as mean ± SE. aP < 0.01 CCl4 group vs corn oil control group, bP < 0.01 calcitriol group vs CCl4 group; cP < 0.0001 pGL4.10-NS3TP1 promoter vs pGL4.10, dP < 0.0001 pGL4.10-NS3TP1 promoter + calcitriol (32 μmol/L) vs pGL4.10-NS3TP1 promoter. ECM: Extracellular matrix; LPS: Lipopolysaccharide; NS3TP1: Nonstructural protein 3-transactivated protein 1; TGFβ1: Transforming growth factor 1 beta 1; CCl4: Carbon tetrachloride.
- Citation: Shi L, Zhou L, Han M, Zhang Y, Zhang Y, Yuan XX, Lu HP, Wang Y, Yang XL, Liu C, Wang J, Liang P, Liu SA, Liu XJ, Cheng J, Lin SM. Calcitriol attenuates liver fibrosis through hepatitis C virus nonstructural protein 3-transactivated protein 1-mediated TGF β1/Smad3 and NF-κB signaling pathways. World J Gastroenterol 2023; 29(18): 2798-2817
- URL: https://www.wjgnet.com/1007-9327/full/v29/i18/2798.htm
- DOI: https://dx.doi.org/10.3748/wjg.v29.i18.2798


