Copyright
©The Author(s) 2023.
World J Gastroenterol. May 14, 2023; 29(18): 2798-2817
Published online May 14, 2023. doi: 10.3748/wjg.v29.i18.2798
Published online May 14, 2023. doi: 10.3748/wjg.v29.i18.2798
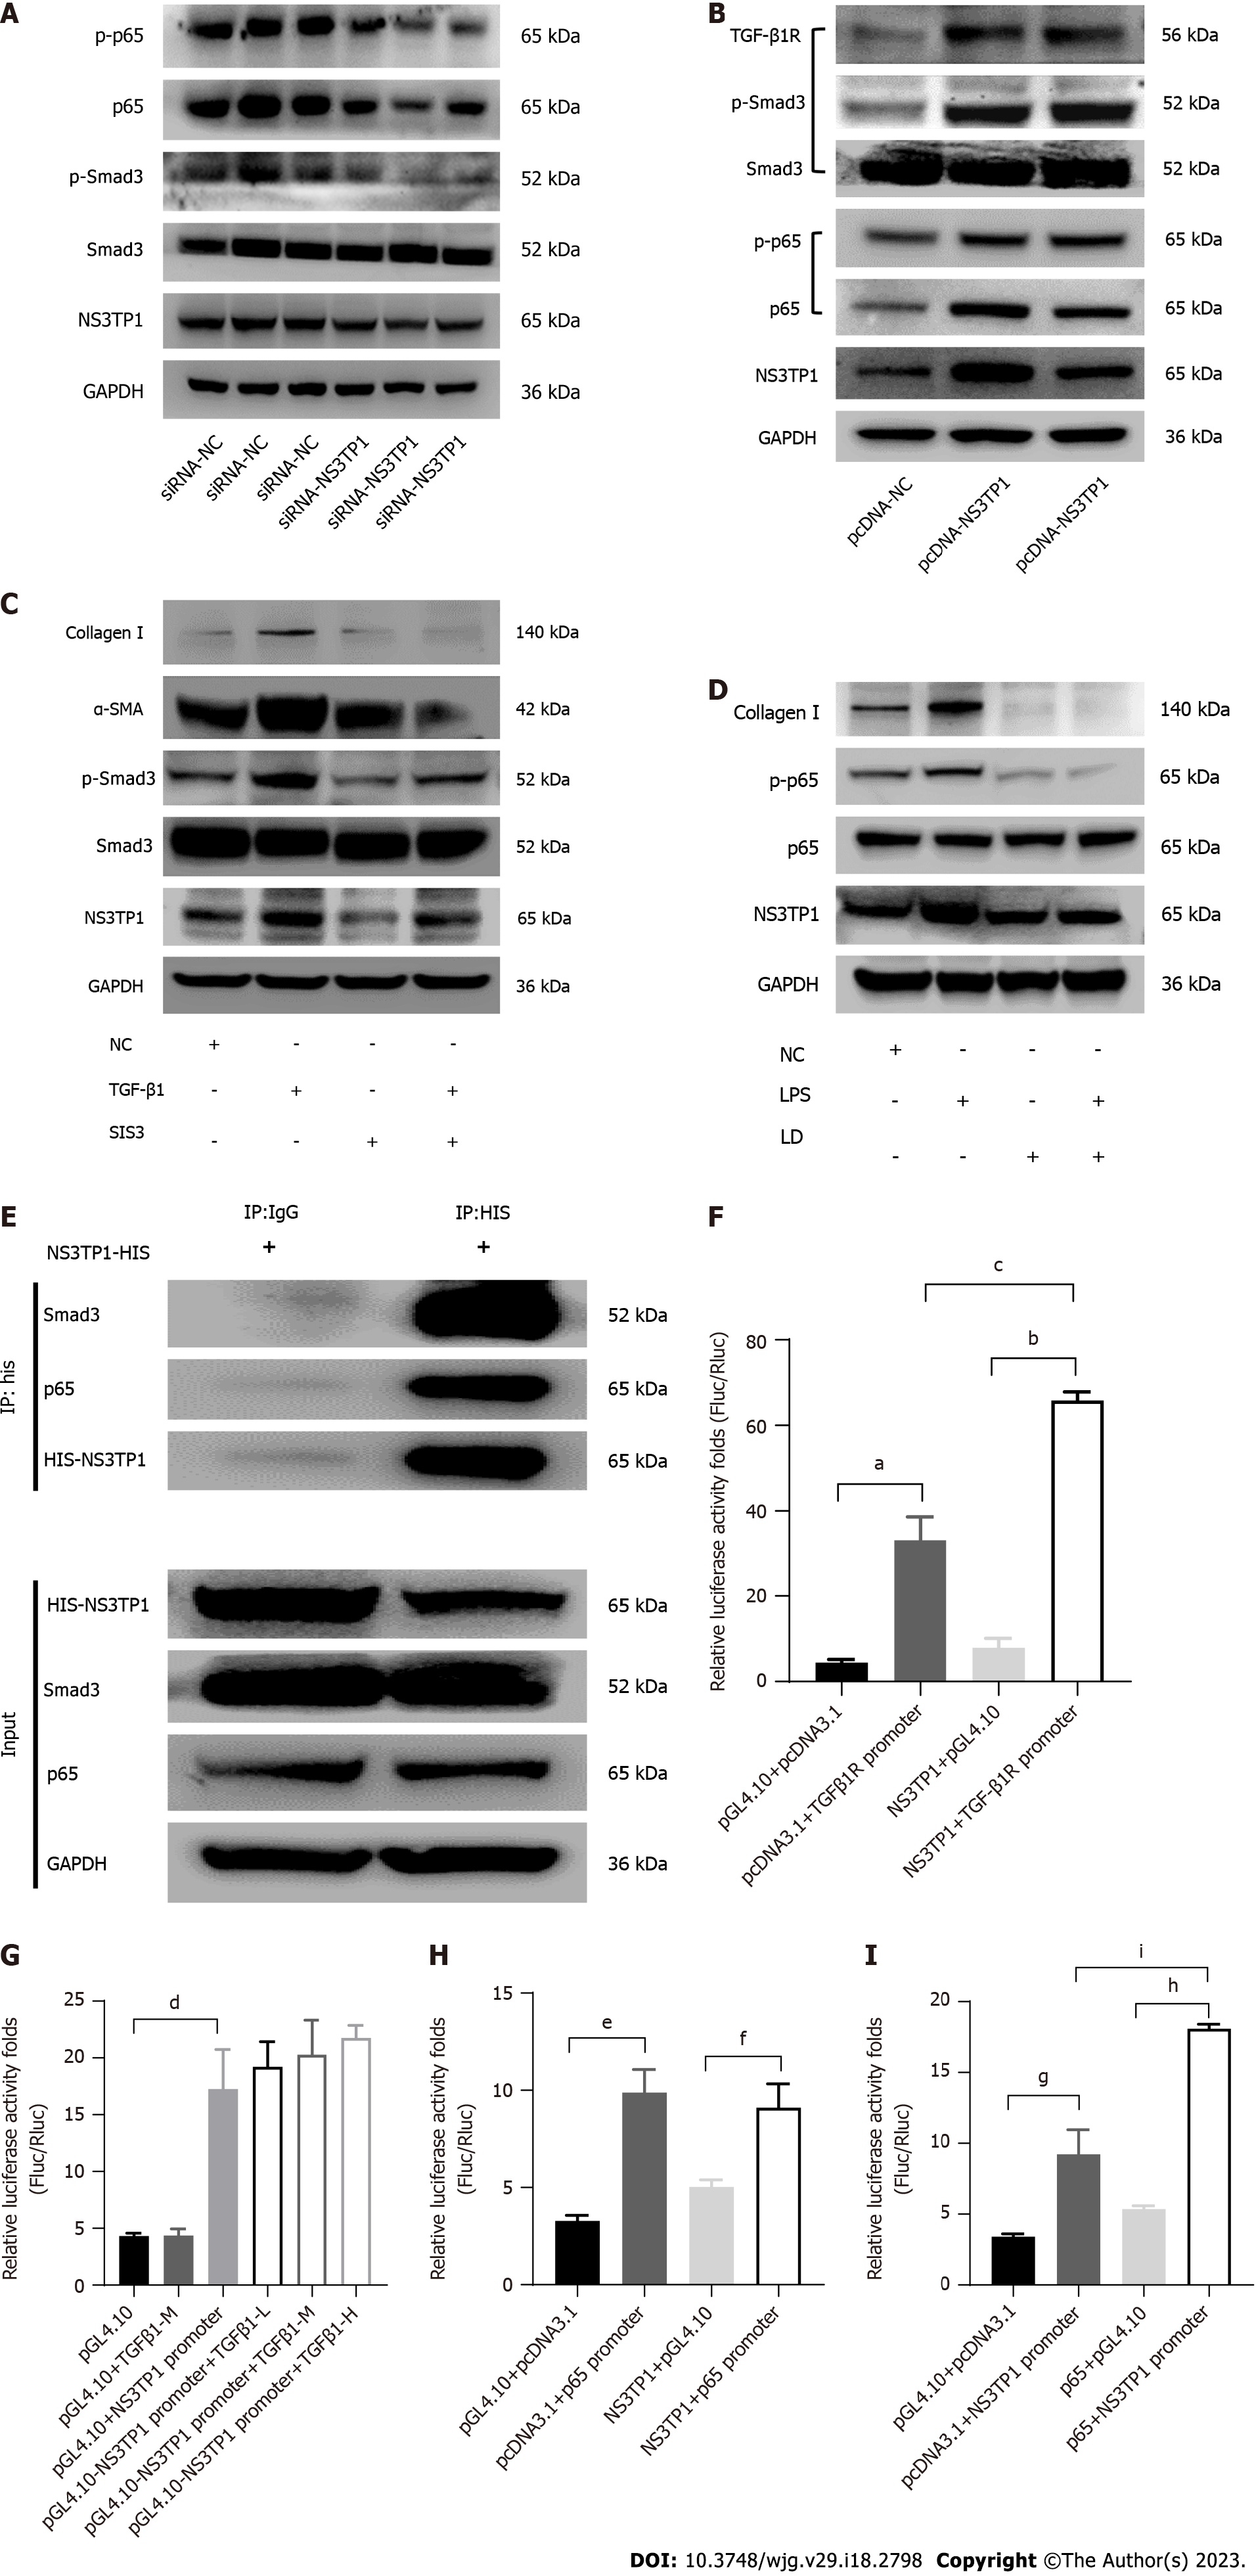
Figure 3 Promotion of nonstructural protein 3-transactivated protein 1 in hepatic fibrosis via transforming growth factor beta 1 receptor/Smad3 and NF-kB signaling pathways.
A and B: The protein levels of molecules in the transforming growth factor beta 1 (TGFβ1)/Smad3 and NF-kB signaling pathways after nonstructural protein 3-transactivated protein 1 (NS3TP1) interference or overexpression in LX-2 cells were analyzed by Western blot (n = 3); C and D: Western blot analysis of the above signaling pathway molecules in LX-2 cells after Smad3-specific inhibitor or licochalcone D treatment (n = 3); E: Coimmunoprecipitation analysis between NS3TP1 and Smad3 or p65; F: Luciferase activity analysis between NS3TP1 and the TGFβ1 receptor 1 (TGFβRI) promoter (n = 3); G: Luciferase activity analysis between TGFβ1 and the NS3TP1 promoter; TGFβ1 (L: 2.5 ng/mL, M: 5 ng/mL, H: 10 ng/mL) (n = 3); H: Luciferase activity analysis between NS3TP1 and the p65 promoter (n = 3); I: Luciferase activity analysis between p65 and the NS3TP1 promoter (n = 3). The data was represented as mean ± SE. aP < 0.001 pcDNA3.1 + TGFβ1R promoter vs pGL4.10 + pcDNA3.1, bP < 0.0001 NS3TP1 + TGFβ1R promoter vs NS3TP1 + pGL4.10; cP < 0.001; NS3TP1 + TGFβ1R promoter vs pcDNA3.1 + TGFβ1R promoter; dP < 0.01 pGL4.10 + NS3TP1 promoter vs pGL4.10; eP < 0.001 pcDNA3.1 + p65 promoter vs pGL4.10 + pcDNA3.1, fP < 0.01 NS3TP1 + p65 promoter vs NS3TP1 + pGL4.10; gP < 0.01 pcDNA3.1 + NS3TP1 promoter vs pGL4.10 + pcDNA3.1, hP < 0.0001 p65 + NS3TP1 promoter vs p65 + pGL4.10; iP < 0.001 p65 + NS3TP1 promoter vs pcDNA3.1 + NS3TP1 promoter. NS3TP1: Nonstructural protein 3-transactivated protein 1; TGFβ1R: Transforming growth factor beta 1 receptor; p-smad3: Phosphorylated sekelsky mothers against decapentaplegic homolog 3; SIS3: Smad3-specific inhibitor; LD: Licochalcone D; Co-IP: Coimmunoprecipitation.
- Citation: Shi L, Zhou L, Han M, Zhang Y, Zhang Y, Yuan XX, Lu HP, Wang Y, Yang XL, Liu C, Wang J, Liang P, Liu SA, Liu XJ, Cheng J, Lin SM. Calcitriol attenuates liver fibrosis through hepatitis C virus nonstructural protein 3-transactivated protein 1-mediated TGF β1/Smad3 and NF-κB signaling pathways. World J Gastroenterol 2023; 29(18): 2798-2817
- URL: https://www.wjgnet.com/1007-9327/full/v29/i18/2798.htm
- DOI: https://dx.doi.org/10.3748/wjg.v29.i18.2798


