Copyright
©The Author(s) 2023.
World J Gastroenterol. May 14, 2023; 29(18): 2798-2817
Published online May 14, 2023. doi: 10.3748/wjg.v29.i18.2798
Published online May 14, 2023. doi: 10.3748/wjg.v29.i18.2798
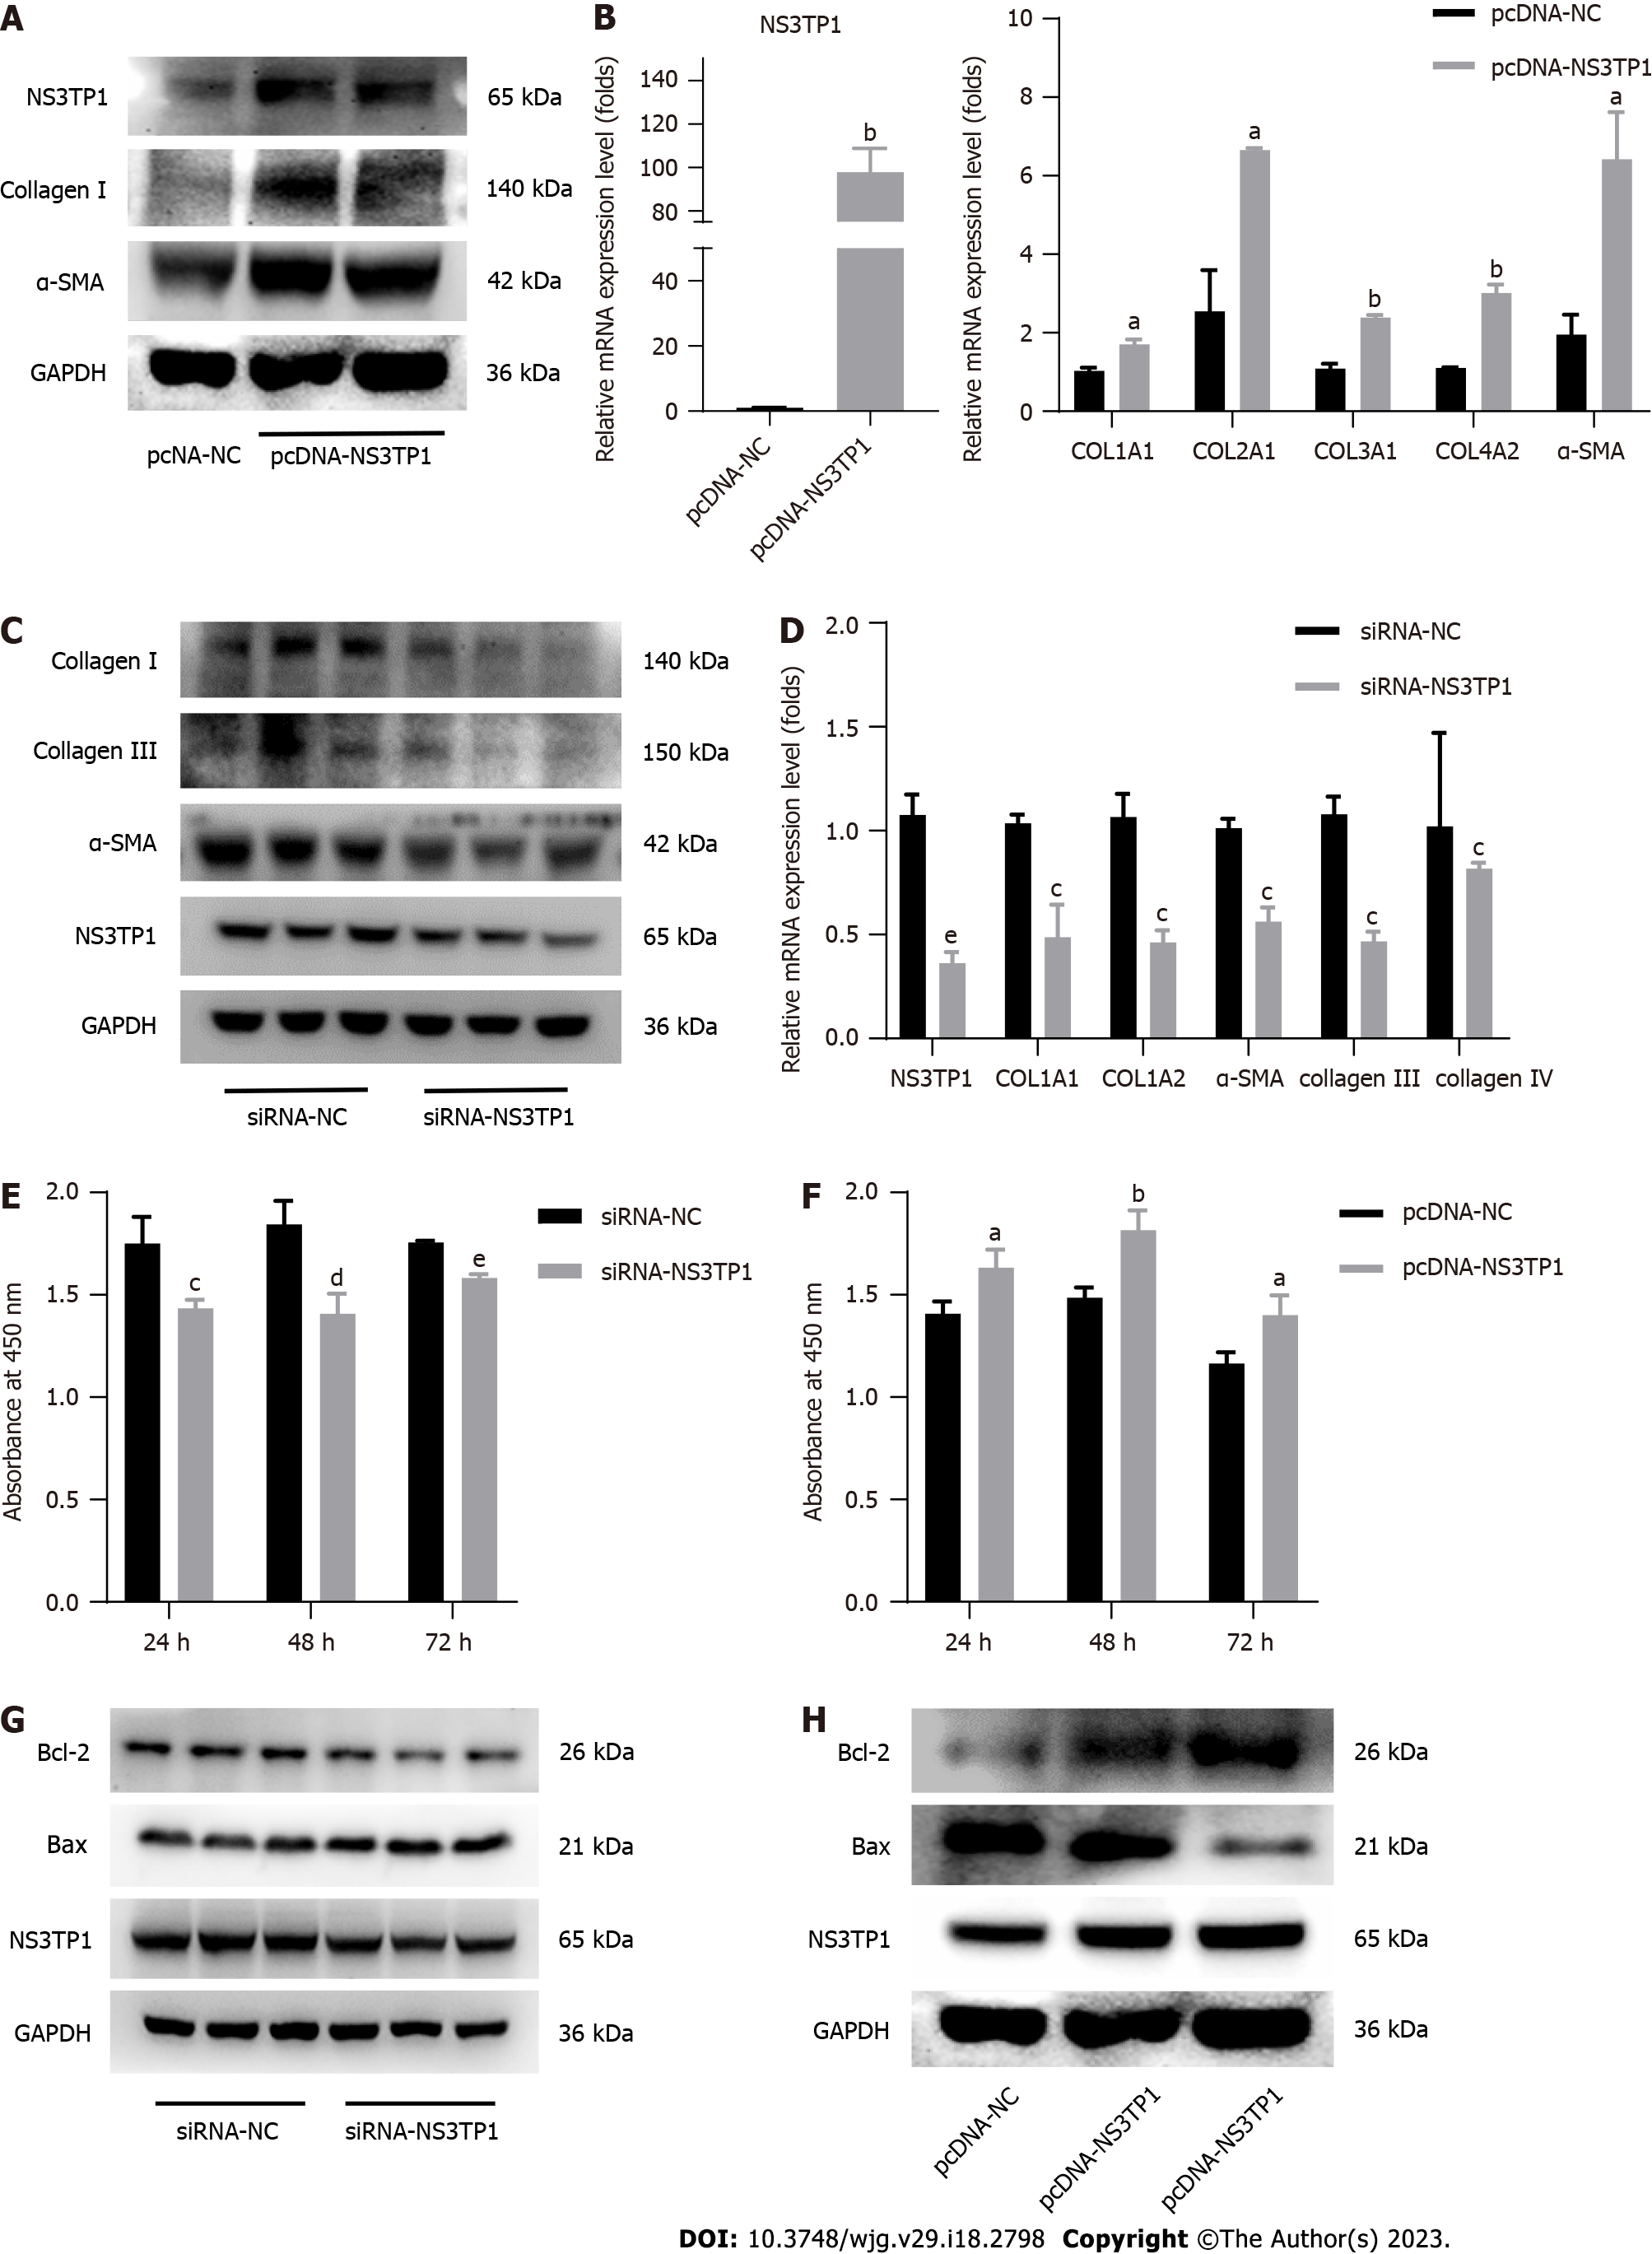
Figure 2 Influence of nonstructural protein 3-transactivated protein 1 on liver fibrosis in vitro.
A: Western blot analysis of fibrosis-related genes after Nonstructural protein 3-transactivated protein 1 (NS3TP1) overexpression (n = 3); B: Real-time quantitative polymerase chain reaction (RT-qPCR) analysis of fibrosis-related genes after NS3TP1 overexpression (n = 3); C: Western blot analysis of the fibrosis-related genes after NS3TP1 interference (n = 3); D: RT-qPCR analysis of the fibrosis-related genes after NS3TP1 interference (n = 3); E and F: Cell proliferation was measured by cell counting kit-8 assays after interference or overexpression of NS3TP1 (n = 3); G and H: Western blot analysis of Bcl-2 and Bax after interference or overexpression of NS3TP1 (n = 3). The data was represented as mean ± SE. aP < 0.05, bP < 0.01 vs pcDNA-NS3TP1 group; cP < 0.05, dP < 0.01, eP < 0.001 vs siRNA-NS3TP1 group. NS3TP1: Nonstructural protein 3-transactivated protein 1; CCK-8: Cell counting kit-8; COL1A1: Type 1 collagen alpha 1 chain; COL1A2: Type 1 collagen alpha 2 chain; COL3A1: Type 3 collagen alpha 1 chain; COL4A2: Type 4 collagen alpha 2 chain.
- Citation: Shi L, Zhou L, Han M, Zhang Y, Zhang Y, Yuan XX, Lu HP, Wang Y, Yang XL, Liu C, Wang J, Liang P, Liu SA, Liu XJ, Cheng J, Lin SM. Calcitriol attenuates liver fibrosis through hepatitis C virus nonstructural protein 3-transactivated protein 1-mediated TGF β1/Smad3 and NF-κB signaling pathways. World J Gastroenterol 2023; 29(18): 2798-2817
- URL: https://www.wjgnet.com/1007-9327/full/v29/i18/2798.htm
- DOI: https://dx.doi.org/10.3748/wjg.v29.i18.2798


